The Video Sentiment question type allows your survey respondents to provide continuous feedback while watching a video, by dragging a slider along a range.
If you would like to gather continuous feedback for audio media instead, use the Audio Sentiment Question Type.
When To Use It
Use the Video Sentiment question to gather continuous feedback on video media.
Respondents can react to the video at any point while it is playing, by moving a slider. Each interaction with the slider is recorded and is time stamped for reports. You can also allow respondents to comment.
Setup
- Click the Question link on the survey page where you would like to add the Video Sentiment question.
- Select Video Sentiment from the Question Type drop-down and enter your overall question text.
- Paste the link to your video into the Video URL field. The video must be hosted on YouTube.

- Provide at least one Report Label. This will ideally describe the category that you are measuring along each slider. If for example, you are wanting to measure respondents' reactions on a scale ranging from sad to happy, your report label might be 'emotion'.
 Think of the report label as a category name for each unique slider bar. Multiple report labels will result in multiple slider bars. The report label is not visible to your survey respondents while taking the survey, but is available to you when reporting on the collected data.
 - Provide Left and Right Labels for each of your report lables - the left and right will be seen by respondents on either side of the slider bar while watching the video.

 Think of the report label as a category name for each unique slider bar. Multiple report labels will result in multiple slider bars. The report label is not visible to your survey respondents while taking the survey, but is available to you when reporting on the collected data.
Best Practice Tip: Multiple Attributes
While you are able to add multiple report labels (sliders) to your Video Sentiment question, consider that asking respondents to watch a video and react to it along multiple sliders at the same time may be a bit overwhelming to some.Allow Comments
You have the option to allow your respondents to provide written comments while viewing your video content. To enable this capability, edit the question and select Allow comments on video sentiment under the Layout tab.
Your respondents will see a comment box below the video player while viewing the video.
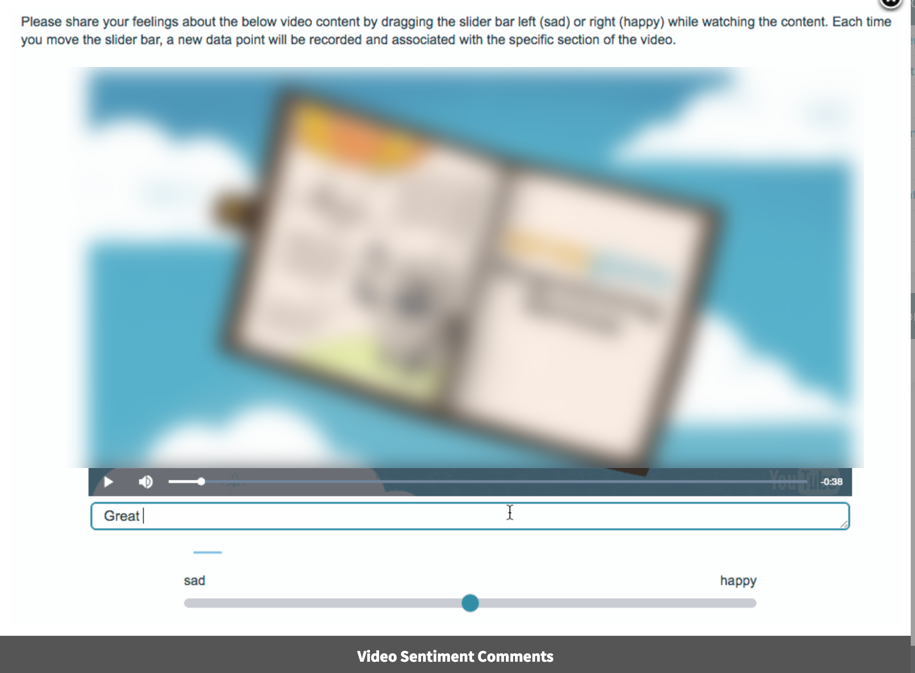
In order to submit a comment, your respondents can input text into the comment field and press the 'Enter' key. For reporting purposes, each comment will be time-stamped based on the point in the video when the comment was submitted.
Note: The video will pause automatically when a respondent clicks into the comment field.
Survey Taking
On a desktop and most laptops, the Video Sentiment question initially appears as follows. An introductory gif plays automatically to familiarize respondents with the question interaction. Once the respondent is ready to view the video, they can click anywhere on the screen to close the gif.

Once the gif has been closed, the respondents will see the video content along with a slider bar for each of your attributes and the comment field (if enabled).
While viewing and reacting to the video, respondents will see a real-time sentiment (reaction) line chart below the video content.

Mobile Compatibility
The Video Sentiment question is not compatible with iOS devices. Respondents using Apple devices will be notified via the following on-screen message:
When optimized for mobile devices, the Video Sentiment question looks quite similar to the desktop version. The right and left labels on the slider portion of the question are displayed above the slider itself to allow more space for this text. You will want to ensure that your text is short enough to display well on a mobile device.

By default, survey questions show one at a time on mobile devices to prevent the need for scrolling on smaller screens. You can turn off this one-at-a-time interaction if you wish.
Reporting
In the Standard Report, the Video Sentiment question reports as a Spline Chart (one chart for each report label) in conjunction with the video element. The Spline Chart represents the average sentiment across all respondents (y-axis) for each second of the video (x-axis). The y-axis values will range from -10 (left label) to 10 (right label).
The Time Dominant data reflects the amount of time (as a percentage) that the slider was shifted to one value (label) or the other.
Note: The Time Dominant data shows the percentage for the left and right values only (the center value is not included). As such the percentage values shown will likely not total 100%.
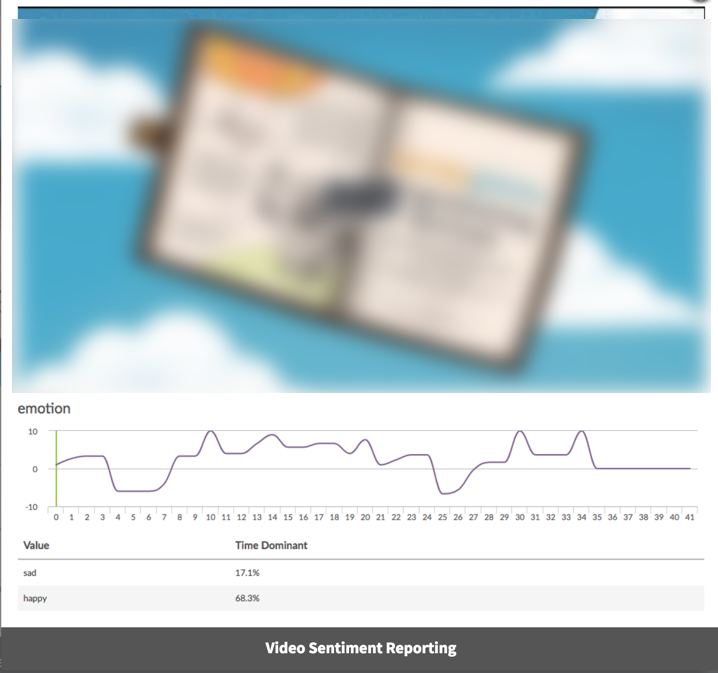
You can play the video within the report and will see the video track across the sentiment chart via a vertical green line. While playing, you can click along the chart to see the corresponding location in the video.

If you have enabled comments for your Video Sentiment question, any comments provided by your respondents will be available as part of the report element. Each comment will be time-stamped based on the point in the video when the comment was submitted. Click Show Responses to view the specific comments.

See additional compatible chart types
Within the Standard Report there are various chart types available for visualizing your data. The below grid shows which of the chart types Video Sentiment questions are compatible with.


See what other report types are compatible
The below grid shows which of the report types Video Sentiment questions are compatible with. If you plan to do some specific analysis within SurveyGizmo this report compatibility chart should help you choose the right question types!
| Report Type | Compatible |
|---|---|
| Standard | |
| Legacy Summary | |
| TURF | |
| Profile | |
| Crosstab | |
| Comparison |
Exporting
In the CSV/Excel export, the data is displayed as a single column for each report label.

The "duration" value refers to the length of the video (in seconds). Each data point thereafter is presented in pairs such as "2":10 where "2" refers to the video location (in seconds) and 10 refers to the slider value ranging from -10 (left label) to 10 (right label).
Admin
— Dave Domagalski on 06/21/2019
@Elpida: Thank you for your question!
I'm afraid that the Video Sentiment question is not compatible with live video. Videos must be hosted on YouTube.
I hope this helps clarify!
David
Technical Writer
SurveyGizmo Customer Experience
— Aboutpeople on 06/21/2019
is there a way to use this on a live video?
Admin
— Bri Hillmer on 12/20/2018
@Petros: The scale ranges from -10 to 10. It is not customizable.
I hope this helps!
Bri Hillmer
Documentation Coordinator
SurveyGizmo Customer Experience Team
— Aboutpeople on 12/20/2018
the scale is from 1-10 or 1-100? is the scale customisable?
Admin
— Dave Domagalski on 08/10/2018
@Franca: Thank you for your question!
At this time, the Video Sentiment question does require that the video is hosted on YouTube.
As such, I'm afraid that any location that is blocking YouTube would not allow respondents to see the video associated with the question.
I hope this helps clarify.
David
Documentation Specialist
SurveyGizmo Customer Experience
— Franca on 08/10/2018
Hi! Would this question work if you're surveying in China? (Since youtube is blocked)
Admin
— Dave Domagalski on 04/18/2017
@Lianna: Great question!
Depending on what exactly you are looking for, either filtering or segmenting your Standard Report data will be good options:
Filtering:
https://help.surveygizmo.com/help/filter-report-data
Segmenting:
https://help.surveygizmo.com/help/compare-data-with-segments
I would recommend segmenting as it will split the sentiment line into multiple lines - one for each segment.
I hope this helps!
David
Documentation Specialist
SurveyGizmo Customer Experience
— Open on 04/18/2017
When viewing results overlaid on the video in reporting, is it possible to view separate lines for a grouping variable (e.g., gender)?
Admin
— Dave Domagalski on 04/07/2017
@Sean: Thank you so much for sharing this!
I'm sure it will be helpful to others who encounter this limitation!
Thank you again!
David
Documentation Specialist
SurveyGizmo Customer Experience
— Sean.mcnally on 04/06/2017
Dave, if the comment box is not included in the question I can get it just in.
Admin
— Dave Domagalski on 04/06/2017
@Sean: Thank you for exploring SurveyGizmo Documentation content!
I'm afraid that the Video Sentiment question does not currently offer re-sizing options.
I will note this with our Development Team as an enhancement request for this question.
I'm sorry for the trouble!
David
Documentation Specialist
SurveyGizmo Customer Experience
— Sean.mcnally on 04/06/2017
Can you resize the video screen? When viewing the video the scroll bar is off screen. Having the scroll bar on screen cuts of the top of the video.
Admin
— Dave Domagalski on 10/25/2016
@Ict: Thank you for your question!
We certainly hope to have the Video Sentiment question available for survey taking on iOS. This functionality is currently limited due to video behavior on iOS devices (videos automatically expanding to full-screen). Future iOS updates may allow for working around this limitation.
I hope this helps clarify!
David
Documentation Specialist/Survey Explorer
SurveyGizmo Customer Experience
— Laura on 10/25/2016
will this be available on ios later on?