
Donut Charts are used to report on single-select questions such as Radio Buttons.
Default Questions
- None
Compatible Questions
- Radio Buttons
- Dropdown Menu
- Rating (Likert Scale)
- Image Select (Single)
- Rows of a Radio Button Grid (Learn how to Report on Grid Rows Separately!)
- Rows of a Dropdown Menu List (Learn how to Report on Grid Rows Separately!)
- Net Promoter Score®
- Cascading Dropdown Menu
Related Chart Types
Available Options for Donut Charts
There are a number of options available for an individual donut chart.
Filter Tab
First, if you wish to filter the data that displays for an individual donut chart, click Filter to the right of the element and use the logic builder. Learn more about filtering an individual element.
- If you wish to display the specific details of your filters below your chart, check the Show Details of Filter with Report Element checkbox below the logic builder.
- You will also see an option to filter this element by Survey Link or Campaign. This filter option will allow you to only include data in this element that was collected via a specific link (or links).
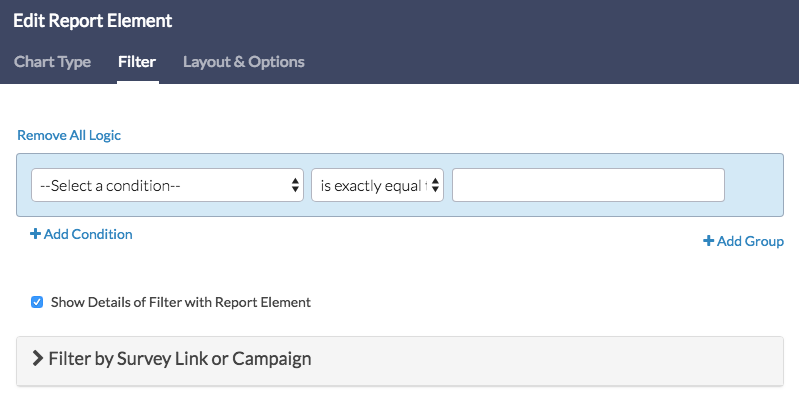

Chart Type Tab
Second, questions that default to display as a Pie Chart can also be displayed as a number of different chart types. Click Chart Type to the right of the element and select a different chart type from the available options.

Layout & Options Tab
To explore even more options, review the settings available within the Layout & Options section.
Question Options
- Chart - Include or exclude the main chart.
- Summary Table - This is the table below the chart that includes the value, percent and count.
- Statistics - See below list of available statistics for this chart type.
Answer Options
- N/A Options - Include or exclude options set as not applicable.
- Disabled Options - If you have disabled certain options on the Build tab, you can still display those in the report by checking this item.
- Answer Options with No Data - If you have answer options with no data that you wish to include in the chart, click this option.
- Answer Option Names - By default, the Original Option Title displayed to survey respondents will display in your report. Toggle to Reporting Value if you wish to display this instead.
- Answer Grouping/Top and Bottom Box - Group your answer options for reporting purposes. Visit the Top Box Reporting article to learn more.
- Order Answers By - Select how you would like the answer options to be ordered; either by Original answer order, Number of responses, or Alphabetically by answer title.
Chart Options
- Chart Size - You can adjust the chart size small, medium, or large.
- Axis Values - Elect to display Option Counts rather than the default Option Percents for your axis values.
Available Statistics:
- Total Responses
- Hidden Count
- Skipped Count
If reporting values are numeric the below statistics are available.
- Sum
- Average
- Min
- Max
- Standard Deviation
Net Promoter, Net Promoter System, Net Promoter Score, NPS and the NPS-related emoticons are registered trademarks of Bain & Company, Inc., Fred Reichheld and Satmetrix Systems, Inc.