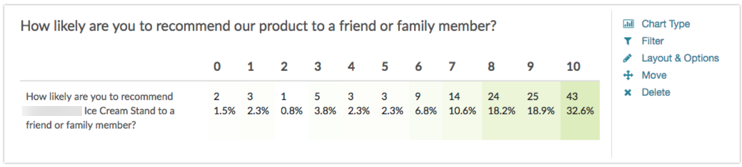
The table reporting element can be used to report on Net Promoter Score® questions with a scale of 0-10. Learn about how the score is calculated here.
By default, the NPS Question will report with a breakdown of Promoters, Passives, and Detractors as well as the NPS Score. By contrast, the table shows a breakdown of responses across the 11 point scale.
To use the Table Element to report on your NPS question, follow these steps.
- Within your Standard Report, click the Chart Type menu associated with your NPS question.
- From the Overall (Aggregate) Charts list, click on the Table option.

- Save your reporting element.

Default Questions
- None
Related Chart Types
Available Options for the Table Element
There are a couple of options available for the table element.
Filter Tab
First, if you wish to filter the data that displays for an individual pie chart, click Filter to the right of the element and use the logic builder. Learn more about filtering an individual element.
- If you wish to display the specific details of your filters below your chart check the Show Details of Filter with Report Element checkbox below the logic builder.
- You will also see an option to filter this element by Survey Link or Campaign. This filter option will allow you to only include data in this element that was collected via a specific link (or links).


Chart Type Tab
Second, questions that default to display as a Pie Chart can also be displayed as a number of different chart types. Click Chart Type to the right of the element and select a different chart type from the available options.
Layout & Options Tab
To explore even more options, review the settings available within the Layout & Options section.
Question Options
- Chart - Include or exclude the main chart.
- Summary Table - This is the table below the chart that includes the percent and count.
Answer Options
- Response Counts - If you would like to exclude the response counts on the far right of the chart uncheck this option.
Grid Options
- Row Total - Check this box to show a total number of responses for the grid. The row total will be displayed as a column on the far right of the table.
Net Promoter, Net Promoter System, Net Promoter Score, NPS and the NPS-related emoticons are registered trademarks of Bain & Company, Inc., Fred Reichheld and Satmetrix Systems, Inc.