A Comparison Report allows you to view your summarized data broken down by a subgroup of the data. This grouping can be set up based on a question in your survey (such as Organization, Gender, Occupation, Question 42, etc).
Comparison Reports are used to examine trends in your survey data across groups, typically demographic categories. If you ask in your survey for an employee's department, you might want to see how satisfied they are with the office's break room setup. So, you could choose "department" as your source question on the report.
You can then see which department favors the break room setup more and what each department said about it!
Compatible Questions Types for Grouping Responses
- Radio Button
- Dropdown Menu (Single-Select Only)
- Rating (Likert Scale)
- Net Promoter Score®
- Hidden Values
Piped questions are not available for comparison.
Create a Comparison Report
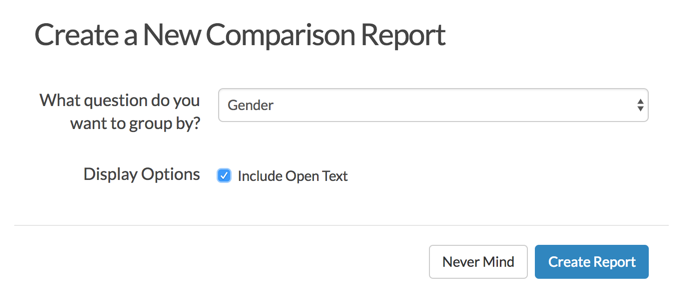
- Go to the Results > Reports and click Create Report > Comparison.
- Choose What field do you want to group by? and indicate whether to Include Open Text responses.
Example: If you have a Gender question in your survey and want to see how every question in your survey breaks down by Gender, you would choose that question from the dropdown. - Click Create Report.

Analyze your Comparison Report Data
Once your Comparison Report has finished running, you'll see tables for each of the questions in your survey. Your source question (the question you are making comparisons across) in the rows of each table and the other questions in your survey as the columns of each table.
For question types that are multi-dimensional such as a Radio Button Grid, there will be multiple tables (one for each column/row header).
When analyzing your data, you'll notice that some question types look different than others. Below we will indicate which question types will display specific ways on the Comparison Report.
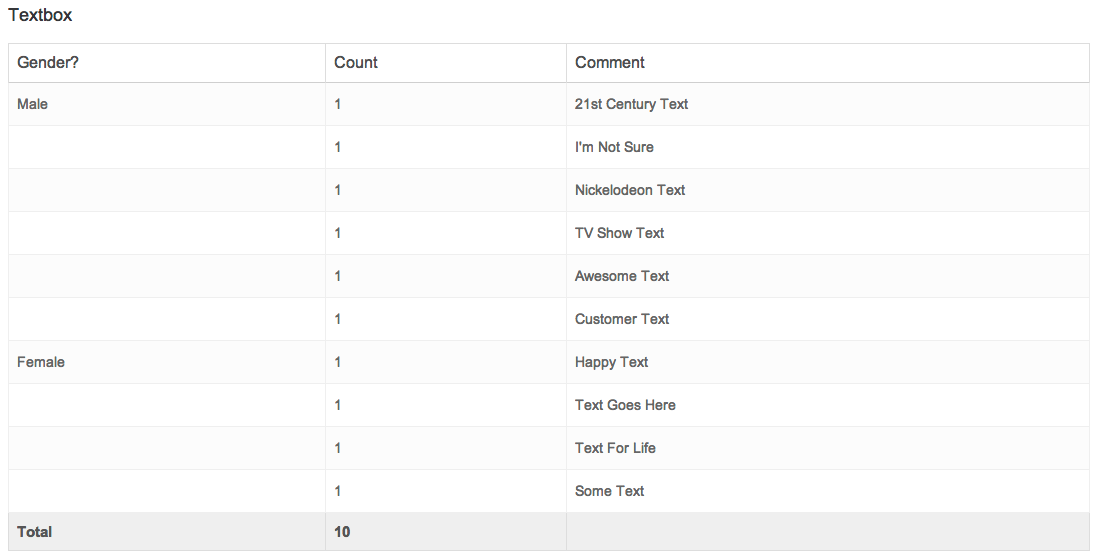
Open-Ended Questions: (Textbox, Essay, List of Textboxes, etc.)
1st Column: This is your grouped by source question. For these examples, we're using a Gender question.
2nd Column: This will be the count of how many people provided the comment listed in the third column (in open-text question types, this will generally be 1).
3rd Column: This is the text that the respondent entered into the question.
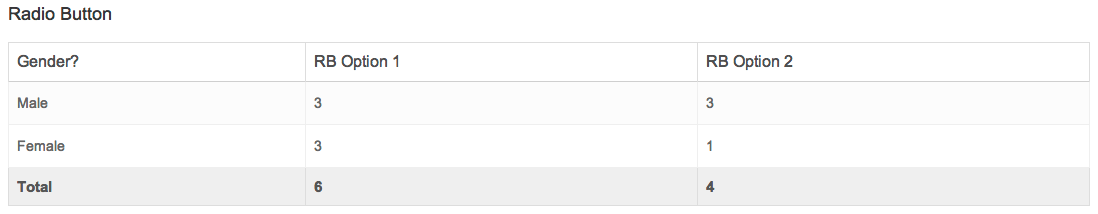
Single Select Questions: (Radio Button, Dropdown Menu, Image Choice (Single), Likert Scale)
For single-select questions, you will see as many columns as there are answer options in the question you're comparing (plus one for the source question). In this case, there are two answer options in this Radio Button question: RB Option 1 and RB Option 2
It will then compare how the respondents of the Grouped by (Gender) question answered the Radio Button question.
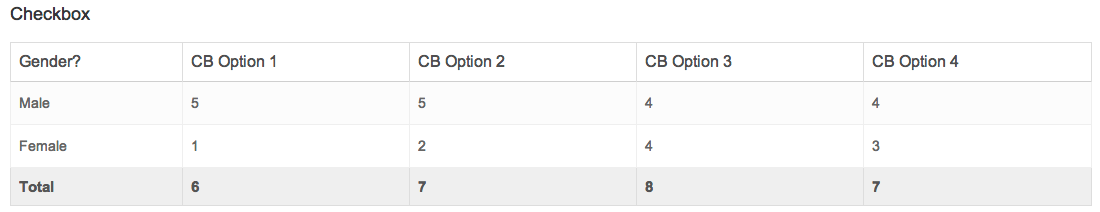
Multiple Select Questions: (Checkbox, Image Select Multiple)
For Multi-Select Questions, you'll see as many columns as there are answer options in the question you're comparing (plus one for the source question). In this case, there are four answer options in this Checkbox Question: CB Option 1, CB Option 2, CB Option 3 and CB Option 4
It will then compare how the respondents of the Grouped by (Gender) answered and how many were answered in the Checkbox question options.
Multi-Dimensional Questions: (Radio Button Grid, Checkbox Grid, Dropdown Menu Grid, Dropdown Menu List, Star Ranking, Custom Group, Custom Table)
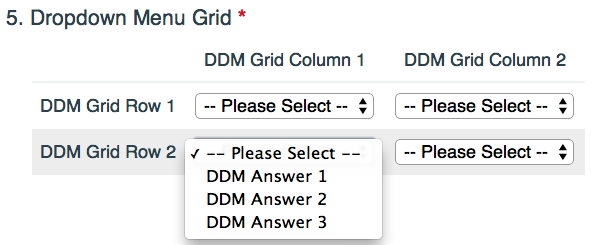
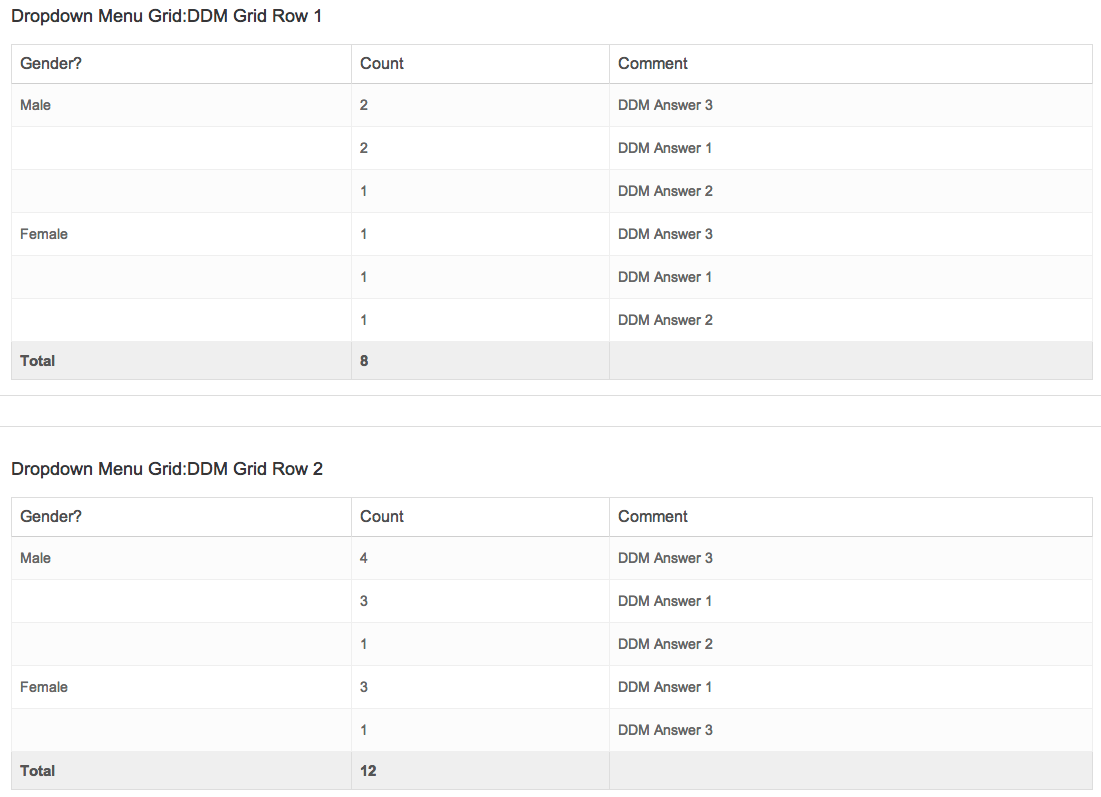
For Multi-Dimensional Questions, you'll see as many columns as there are answer options in the question you're comparing (plus one for the source question). However, you will also see multiple tables based on the number of rows in the question. In this case, there are three answer options for each dropdown menu, and two columns within the table. Here is the original question:
This will compare how respondents of the Grouped by (Gender) answered and how many answered the Dropdown Menu Grid question options.
Incompatible Question Types
There are a few question types that are not compatible with the Comparison Report:
- Drag and Drop Ranking
- Ranking Grid
- Continuous Sum
Net Promoter, Net Promoter System, Net Promoter Score, NPS and the NPS-related emoticons are registered trademarks of Bain & Company, Inc., Fred Reichheld and Satmetrix Systems, Inc.
Admin
— Dave Domagalski on 07/17/2019
@Mariya: Thank you for your question!
If I'm understanding correctly, I'm afraid that it is not possible to show two charts in one question within the Comparison Report.
As a potential alternative, segmentation within the Standard Report may be worth exploring:
https://help.surveygizmo.com/help/compare-data-with-segments
I hope this helps!
David
Technical Writer
SurveyGizmo Customer Experience
— Mariya on 07/17/2019
Hello! Is it possible to make a comparison report, where two charts in one question can be shown? Not collected results from two data bases in one chart, but two charts from two data bases?
Admin
— Bri Hillmer on 09/02/2016
@Jeoff: At this time that is the only way to achieve longitudinal reporting like you describe. The development team has talked about making this easier to achieve but I don't have a timeline on when this would happen. Thanks for your feedback; this always helps us to prioritize improvements!
Bri
Documentation Coordinator/Survey Sorceress
SurveyGizmo Customer Experience Team
— Jeoff on 09/02/2016
How can I get a month-by-month comparison of NPS? (other than by creating a segment for each monthly manually, which seems very tedious)
Admin
— Dave Domagalski on 05/23/2016
@Dkanneganti: Thank you for exploring SurveyGizmo documentation!
I recommend exploring the Segmentation capabilities with the new Standard Report as an alternative to the Comparison Report:
https://help.surveygizmo.com/help/article/link/segmentation
Segments will allow you to view your data broken down by categories that you create.
I hope this helps!
David Domagalski
Survey Explorer
SurveyGizmo Customer Support
— Bailitadmin on 05/23/2016
Is it possible to create something similar to the comparison report with the Basic plan?
Admin
— Bri Hillmer on 01/13/2016
@John: I'm not sure what you mean by banners but I will say if the comparison report is not giving you what you need sometimes users are happy with the Cross Tab report which is much like the comparison report but gives you a little more control.
Check out our documentation on the Cross Tab report here:
http://help.surveygizmo.com/help/article/link/cross-tab-report
I hope this helps!
Bri
Documentation Coordinator/Survey Sorceress
SurveyGizmo Customer Support
— John on 01/13/2016
I just want to run some simple banners. How do I do that?
Admin
— Bri Hillmer on 11/16/2015
@Japhet: Our Segmentation Report will give you a graphical representation of the kind of data you see in a Comparison Report.
Here is the Segmentation Report Tutorial:
http://help.surveygizmo.com/help/article/link/segmentation
Alternatively you can export the Comparison Report to Excel in order to create a graph.
I hope this helps!
Bri
Documentation Coordinator/Survey Sorceress
SurveyGizmo Customer Support
— Japhet on 11/12/2015
Hi! I am wondering if there is a way to create a graph of/from the comparison report?
Admin
— Bri Hillmer on 11/05/2015
@Joseph: I'm sorry to say that the Comparison Report doesn't have row averages but this is a great idea for a future improvement for this report. In the meantime, you can create a series of Summary Reports filtered for each session to get the average number for comparison purposes.
Thanks for checking out our documentation and sending feedback!
Bri
Documentation Coordinator/Survey Sorceress
SurveyGizmo Customer Support
— Joseph on 11/04/2015
Hello. I am attempting to generate a comparison report by learning session date as that's our first question we use to filter results. However, I can't seem to get the average response stat to show up for the question comparisons. For example, many of our questions are likert scale 1-5 and we base our success off the average score. How can I compare the average score for each question in a comparison report? I see the tables and the % breakdown but that's not useful data...the averages are what matter and I don't see any way to obtain this vital statistic?
Admin
— Bri Hillmer on 09/29/2015
@Al: Good to hear from you in documentation! Hidden values are available for grouping responses. You mentioned "role" however which is an email campaign contact field so this one won't be available. But if you set up a hidden value with the merge code in this field you'll be all set!
Check out this tutorial for more info:
https://help.surveygizmo.com/help/article/link/using-contact-data
I hope this helps!
Bri
Documentation Coordinator/Survey Sorceress
SurveyGizmo Customer Support
— Al on 09/28/2015
@Bri: Is there a way to run a comparison report grouped by a hidden value such as 'role' ?
Admin
— Bri Hillmer on 07/23/2015
@Eric: Thanks for taking a look at our documentation and leaving feedback. Have you checked out our Cross Tab report? This report includes either vertical or horizontal percentages. Here is our documentation on how to set this up:
http://help.surveygizmo.com/help/article/link/cross-tab-report
Bri
Documentation Coordinator/Survey Sorceress
SurveyGizmo Customer Support
— Eric on 07/22/2015
Showing percentages in these tables would also be extremely helpful. If the comparison groups are different sample sizes, response counts don't really tell you much at a glance, but percentages certainly would.
Admin
— Bri Hillmer on 07/10/2015
@Sstreicher: That's great feedback! I'll let our video guru know!
Bri
Documentation Coordinator/Survey Sorceress
SurveyGizmo Customer Support
— Sstreicher on 07/09/2015
a video might help explain it better
Admin
— Dave Domagalski on 06/22/2015
@Jenna: Thank you for exploring SurveyGizmo documentation and for leaving a comment! Unfortunately, at this time row averages for tables in Comparison Reports are not available. I will be making a note of this for discussion with our Development Team as a potential future improvement.
Thank you again!
David Domagalski
Survey Explorer
SurveyGizmo Customer Support
— Jenna on 06/22/2015
I have a comparison report set up where I want to see responses to my other likert survey questions based on how people answered the first question. I was wondering if it is possible to get row averages in the comparison table like you do with the summary report tables