Using Segments in the Standard Report you can compare subgroups within your data. Typically, segments are groups within your data that you would like to make comparisons across. For instance, you might compare responses for males and females, age groups, or other demographic or firmographic characteristic.
Segments can be set up based on:
- Question Answers
- Response Status
- Response ID Number(s)
- Response Date
- Survey Link
You can also create Advanced Segments with multiple conditions and/or groups of conditions. These advanced segments also allow you to segment based on URL variable values and Email Campaign contact fields, among others.
Add Segments to Your Standard Report
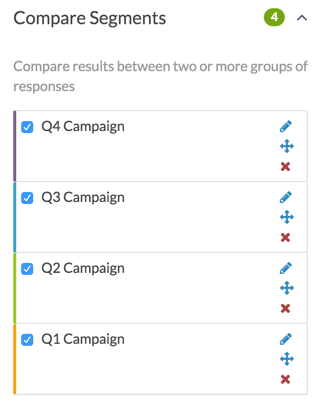
To add a segment to your Standard Report click the Compare Segments option in the left-hand panel. Then click Add Segment.
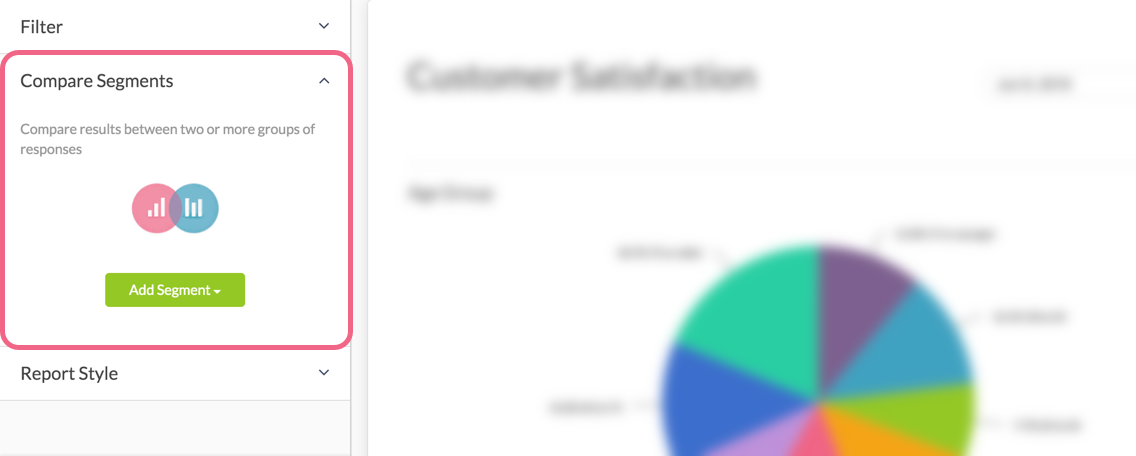
You have six options available for creating segments.
Segment by Question Answers
Use the By Question Answers option to add segments for the answer(s) to a single question. You can add as many of these segments as you wish.
Let's say, for example, that we asked our respondents to provide their gender and we wish to see how the data for males and females compares.
- To get started we will click Compare Segments > Add Segment > By Question Answers.
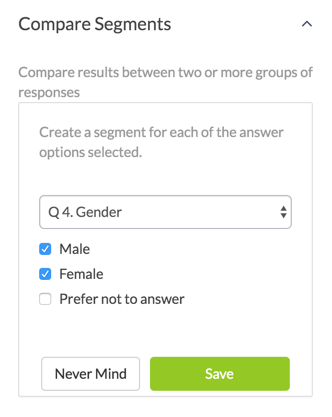
- In the first dropdown we will select the question we wish to use to create segments; that is "Gender". All available answer options will be selected by default. Feel free to de-select any options that you do not want to include in the segments. When finished, click Save.
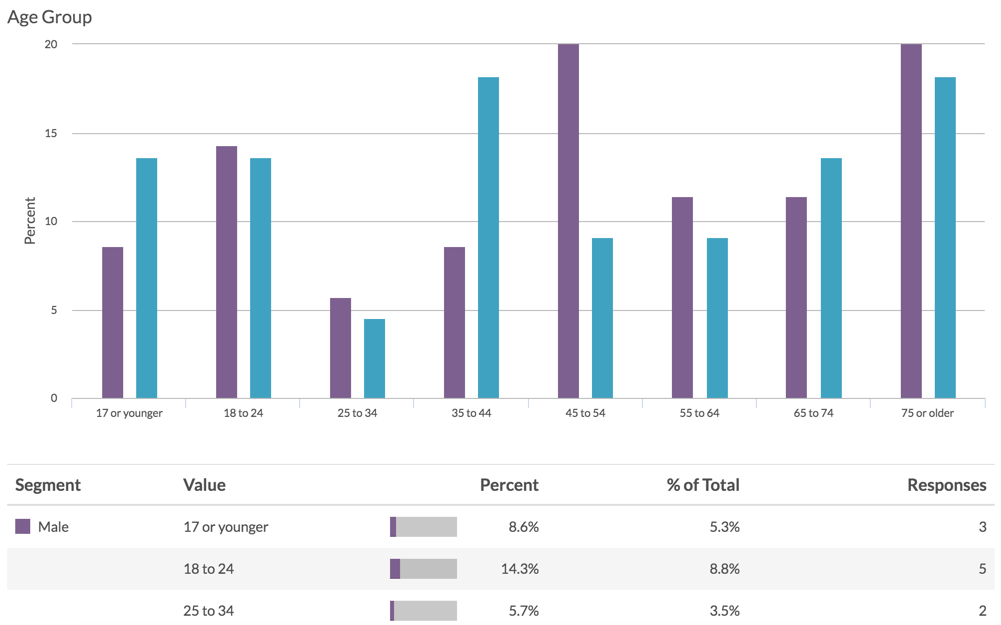
When you click Save, each question* in your survey will be grouped by the segments you selected.
*If creating segments based on a question (such as the gender question in this example), this question itself will not be segmented. In other words, your gender question will not be segmented based on itself.
Segment by Response Status
If you expect that your data might differ based on the response status, you can create a segment for Complete, Partial, and/or Disqualified responses and compare your data accordingly.
- Click Compare Segments > Add Segment > By Response Status. You will need to create a separate segment for each status. For example, one segment for Complete and another segment for Disqualified.
- Provide a Segment Name, change the associated color if needed, and select the desired response status. For example, we will name our first segment Complete Responses and will select the Completed response status.
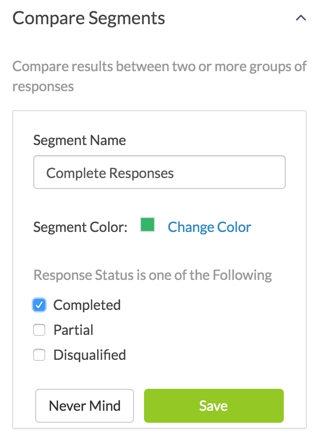
- Click Save to create your segment. Repeat this process for each additional response status that you want to segment by.
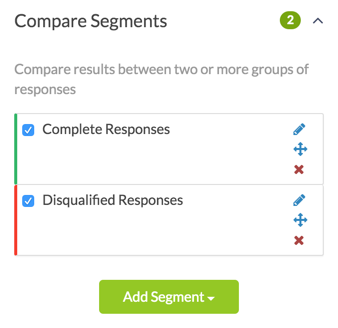
Learn more about response status in SurveyGizmo.
Segment by Response IDs
If you have specific Response IDs that you wish to group together for comparison purposes you can create segments using either an Include the Following Response IDs and/or an Exclude the Following Response IDs approach for your segmentation purposes.
- Click Compare Segments > Add Segment > By Response IDs.
- Provide a Segment Name and change the associated color, if needed.
- You can then populate either or both the include or exclude fields. These values can be comma separated and/or ranges can be specified.
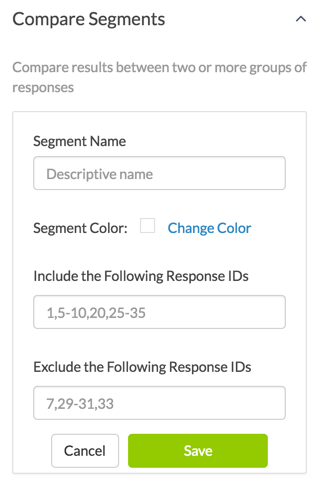
- Click Save to create your segment. Repeat this process for each additional response ID segment that you want to create.
Segment by Survey Link
If you have multiple share links (email campaigns, embeds, default web links, etc), you can create segments by specific links. Creating and using multiple links is a great segmentation option.
- Click Compare Segments > Add Segment > By Survey Link. All available links will be presented.
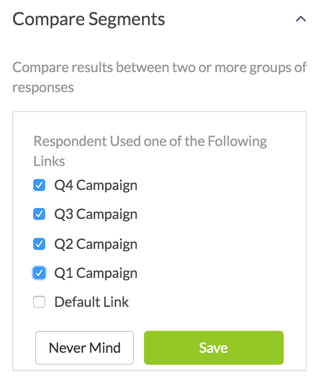
- Select all the links that you want to segment by and click Save. A separate segment will be created for each selected link.
Create Advanced Segment
This option gives you access to the logic builder you've likely become pretty familiar with by the time you start reporting on your survey data. Using the logic builder, you can set up logic conditions on questions in your survey and choose whether to join them with an AND or OR operator.
Using the Advanced Segment option, you can:
- set up multiple conditions or groups of conditions
- create segments based on things like:
- To create an Advanced Segment, click Compare Segments > Add Segment > Create Advanced Segment.
- Provide a Segment Name and change the color, if needed.
- Click Edit Logic to bring up the logic builder for your advanced segment.
- Click the Select a Condition option to choose the source of your segment. This could be a survey question, URL variable, or Email Campaign field among others.
- Choose a logic operator.
- Define the data that will be included in the segment.
Keep in mind that the Advanced Segment option allows you to build segment rules with multiple conditions and/or groups. In our example, we are creating a segment based on answers to two separate survey questions.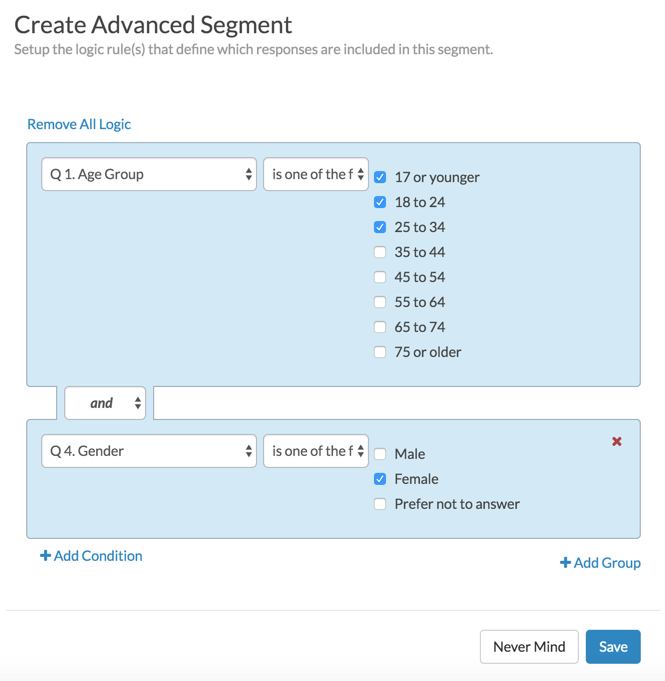
- Make sure to Save your segment when you are finished setting it up.
Re-Order Segments
By default, segments are arranged in the order that they are created (in the case of questions, the segments are arranged according to the order of answer options).
If you prefer to display your segments in a different order than the default, click on the segment's crosshairs icon and drag that segment into another spot. The new order of your segments will be applied to any report elements affected by the segments.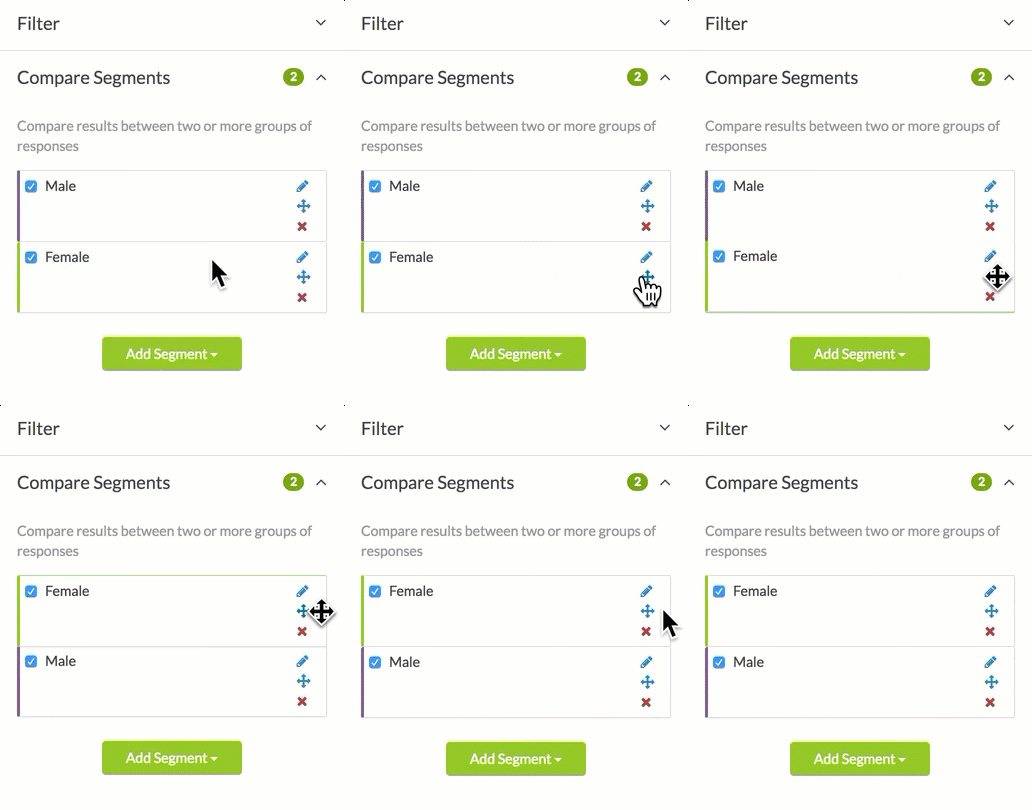
Understanding Segmentation Counts and Percentages
As of September 1, 2016 segmented data in the Standard Report will be 'grouped by segment' by default. Reports created prior to this date will have segmented data grouped by answer options. You can pivot segmented charts to group by answer options if you prefer.
When you create and apply segments to your Standard Report, your data is then broken down across these segments.
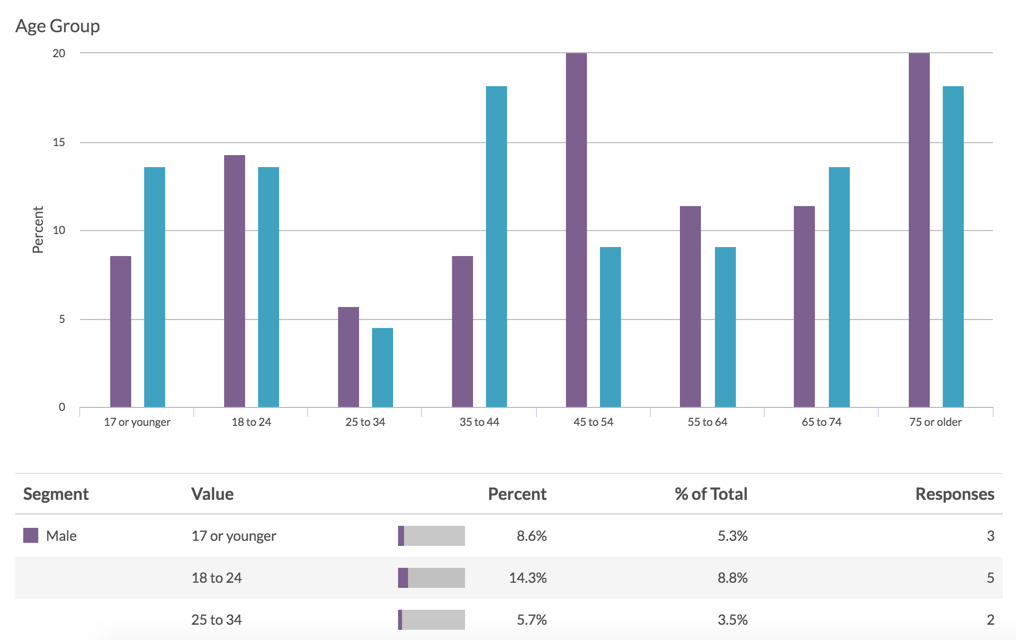
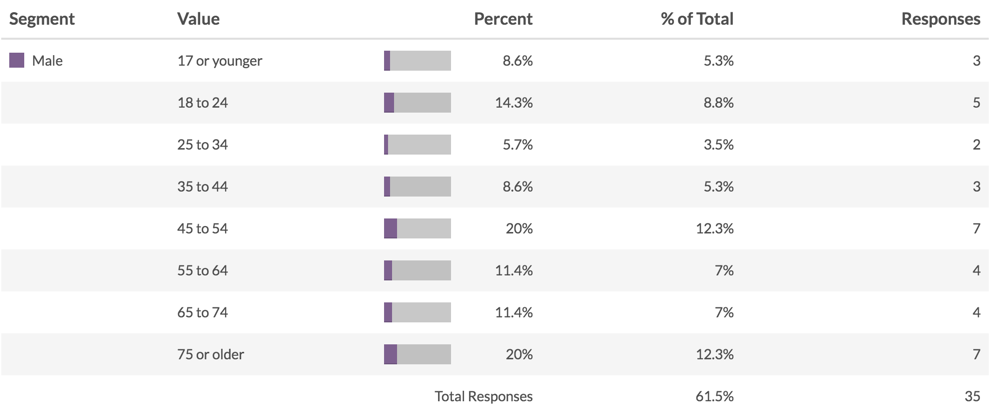
For example, we have created two segments based on the gender question in our survey (Male and Female). Now, looking at our Age Group question we can see that of the 61.5% of respondents who indicated they are male:
- 3 are 17 or younger
- 5 are 18 to 24
- 2 are 25 to 34
- 3 are 35 to 44
- 7 are 45 to 54
- 4 are 55 to 64
- 4 are 65 to 74
- 7 are 75 or older
Thus, the denominator for the Percent calculations is 35 or the total for the Male segment. We see that 7 of the 35 males said they are 45 to 54, or 20% of Males.
Pivoting Segmented Charts
When working with segments, the Standard Report will group your data according to your segments by default.
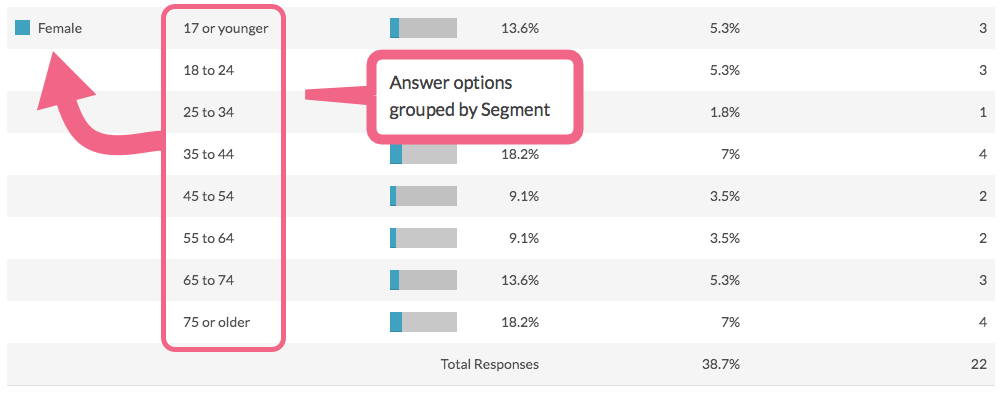
The Percent column shows us the percentage breakdown of answers within each segment. In the example above, we see that 7% of the Female segment is in the 75 or older Age Group. The percentage is based on the total number of individuals in the Female segment, 22 in the above example.
If you prefer to look at your segmented data grouped by answer option, segmented charts can now be pivoted or Grouped by Answer Option.
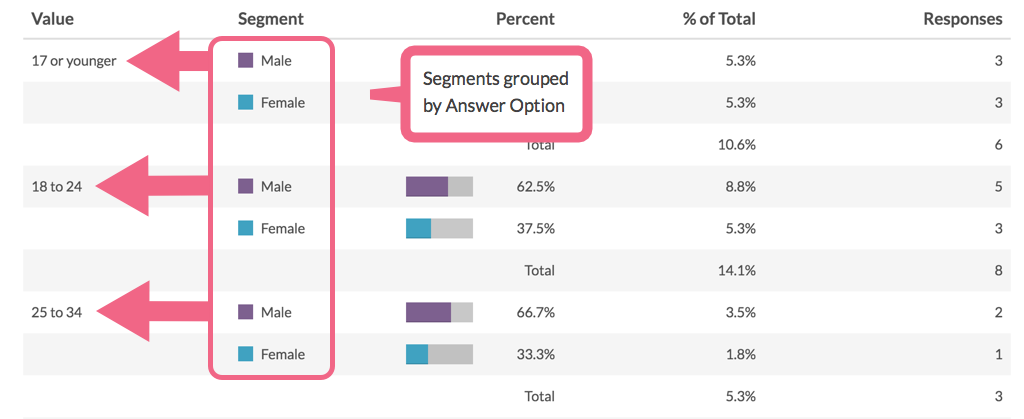
In this case, the Percent column shows us the percentage breakdown of your segments per each answer option. In the example above we see that of those individuals who are in the 18 to 24 Age Group, 37.5% belong to the Female segment. The percentage is based on the total number of individuals who are in the 18 to 24 Age Group, 8 in the above example.
Pivot Segmented Data for an Entire Report
Data can be pivoted globally for the entire report, or per individual element.
- To pivot your segmented data globally, access the Report Options in the upper right of your report.
- Navigate to Charts > Group Segmented Charts by and select Answer Option.
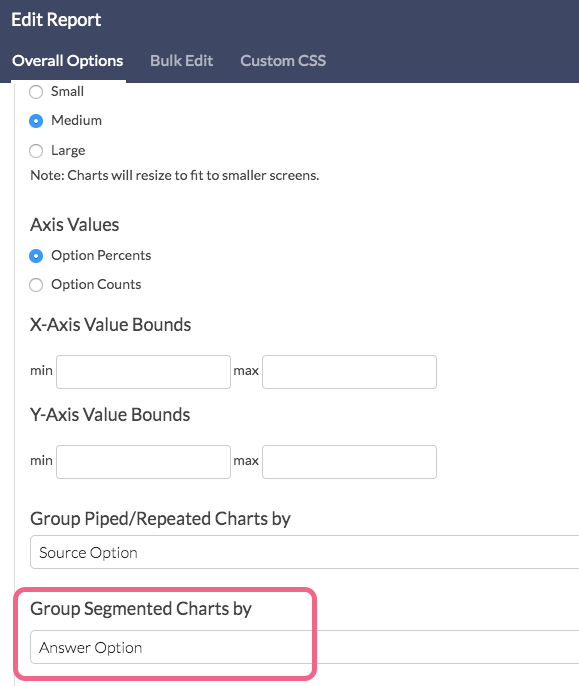
- Click Save to save your changes. By default, segmented charts will be grouped by Segment.
Pivot Segmented Data for a Single Element
- To pivot a specific question's reporting element, edit that element via Layout & Options.
- Navigate to Segmentation Options and toggle the Group Segmented Charts by dropdown menu to your desired setting.
Compatibility
The following question types are not compatible with segments:
The maximum number of segments that can be created is 25.
FAQ
Can I combine two answer options into one segment?
You can! This is why we created the Advanced Segment option. Using the logic builder you can build specific conditions within and across segments.
Can I segment my survey data according to Email Campaign fields?
Yes, using the Create Advanced Segment option, you can target Email Invite Data to create segments. Any information that you uploaded and mapped via an Email Campaign, will be available for segmentation here.


Admin
— Dave Domagalski on 11/25/2019
@Sue: Thank you for your question!
While filter and segment conditions can be built using the same data/criteria, the end results are quite different.
In general, segments in SurveyGizmo allow you to see how data breaks down side by side, for example how answers to a single question compare for female vs male respondents.
Filters, on the other hand, allow you to see a specific subset of data, for example how only female respondents answered a specific question (while excluding male respondents altogether).
I hope this helps clarify!
David
Technical Writer
SurveyGizmo Learning & Development
— Sue on 11/25/2019
Is 'Filter" the same as 'Segment' in SurveyGizmo terminology?
Admin
— Dave Domagalski on 06/06/2019
@Vaida: Thank you for your question!
I’m sorry for the trouble! The best way to create segments based on language is to use the 'Create Advanced Segment' option available after clicking the 'Add Segment' button.
The Advanced Segment option allows you to build a logic rule based on the language variable (sglocale). The logic rule would look the same as the example provided here:
https://help.surveygizmo.com/help/language-logic#setting-up-language-based-logic
You can find a reference to the available language codes here:
https://help.surveygizmo.com/help/language-logic#language-codes
I hope this helps! Please don’t hesitate to reach out to our Support team with any follow up questions:
https://help.surveygizmo.com/help/surveygizmo-support-hours
David
Technical Writer
SurveyGizmo Customer Experience
— Research on 06/06/2019
My survey was filled in 3 languages, and I want to make segments based on that. There is a language variable when exporting the results, however, there is no language variable anywhere in the Report section. Am I missing some important settings in the report building?
Admin
— Bri Hillmer on 09/15/2016
@Eseiver: You cannot currently reorder segments but I have heard from other customers that this is something they are looking to do. I'll pass this along to the development team as a possible future improvement!
Bri
Documentation Coordinator/Survey Sorceress
SurveyGizmo Customer Experience Team
— Eseiver on 09/15/2016
Can we reorder the segments in the report?
Admin
— Bri Hillmer on 08/30/2016
@Andres: I am happy to report that we have some changes that are currently being QA tested. They include changing how segments display by default to display within segment instead of within answer option, as well as, an option to change to display within answer option if you wish. Should be released pretty soon!
Thanks for your patience while we work to get segments working for everyone!
Bri
Documentation Coordinator/Survey Sorceress
SurveyGizmo Customer Experience Team
— Anders on 08/30/2016
What's the status on changing the segment report? As it is now it is unfortunately useless if you want to present how the segments differ in the answers...
Admin
— Bri Hillmer on 05/11/2016
@Herbert: Thank you! Your response is indeed very helpful!
Bri
Documentation Coordinator/Survey Sorceress
SurveyGizmo Customer Support
— Herbert on 05/10/2016
@Bri Hillmer: Survey done. I hope the inputs are helpful.
Admin
— Bri Hillmer on 05/10/2016
We Need Your Feedback!
We’ve been getting a fair amount of feedback that our Segments in the Standard Report are not displayed in the format that users need. We’d like to make sure that we’re hearing from everybody that uses segments to make sure that any potential changes will make all users happier.
Please answer the questions in this survey about segments.
http://www.surveygizmo.com/s3/2768707/Segments-Feedback
Thanks in advance for your time and feedback!
Admin
— Bri Hillmer on 05/10/2016
@Herbert: Thanks for your feedback. This continues to come up as you can see below. We'd like to get some more feedback. Please take a moment to add your voice in the below survey:
http://www.surveygizmo.com/s3/2768707/Segments-Feedback
Bri
Documentation Coordinator/Survey Sorceress
SurveyGizmo Customer Support
— Herbert on 05/05/2016
@Bri Hillmer: The way Nourish looks into the segment data makes more sense. When we say segments, we really want to know the pattern on how the respondents in a segment answer to a series of questions. In your example, creating "chocolate", "strawberry" and "vanilla" segments only enables us to see the distribution of male and female on that particular question (i.e. flavor). However, if there are several questions to follow (e.g. toppings, sizes, etc) that we also want to see how male and female respond, we have to create many segments based on the answers available for toppings, sizes, etc. I don't think this is a solution.
Besides, comparing the absolute count of a segment against the absolute count of another segment usually don't have much meaning. Will you consider making "% within the segment" as optional?
Admin
— Bri Hillmer on 03/17/2016
@Nourish: This comes up quite a bit actually. If you wish to see the data broken down as you describe then you would create segments for chocolate, strawberry and vanilla. I'll update the documentation accordingly as this comes up quite a bit, I think my example is the rarer case of how you might wish to look at the data!
Thanks for the feedback!
Bri
Documentation Coordinator/Survey Sorceress
SurveyGizmo Customer Support
— Nourish on 03/17/2016
Your segmentation tool is not helpful.
For example, if the distribution of segments is not even, the segments are almost useless. If I invite 30 females and 15 males to our banquet and I want to know what flavor of ice cream to serve I ask what their favorite flavor of ice cream is;
14 females choose chocolate, 15 females choose vanilla, 1 females choose strawberry
4 males choose chocolate, 10 choose vanilla, and 1 choose strawberry.
Your segmentation tool tells me that 50% of those 2 people that answered "strawberry" were male or that 40% of those that chose vanilla were male? I can't do anything with that information without doing more math on my own!
What would be useful is to know that only 6.67% of male respondents like strawberry the best or that 66.67% of males like vanilla the best. Now I can actually use this data to determine how much of ice cream flavor to serve at my banquet based on the RSVPs.
Are there settings where I can change how the segmentation works? Am I missing something?
Admin
— Bri Hillmer on 01/27/2016
@Gisa: You can report on the individual rows of a Grid question by unchecking the overall grid question and selecting the rows instead on the Questions tab of the Segmentation report. Here is a screenshot of what I am referring to:
http://www.screencast.com/t/yFkHZQKd
I hope this helps!
Bri
Documentation Coordinator/Survey Sorceress
SurveyGizmo Customer Support
— Gisa on 01/27/2016
Can I show grid questions also as Chart with bars? In the Segmentation Report they are shown as a grid which is not really a helpful visualisation.
Admin
— Bri Hillmer on 01/22/2016
@jmiyasaka: At this time you cannot create segments based off the custom fields in email lists. We are working on some improvements in the segmentation report so I will definitely make note of this for discussion with the development team!
Bri
Documentation Coordinator/Survey Sorceress
SurveyGizmo Customer Support
— Jmiyasaka on 01/22/2016
Can you use custom fields from a Contact List to create segments? I have a custom field titled "Age Segment" with four possible groups (e.g., young households, empty nesters, etc.). Can I take a question like "how satisfied are you with..." and show the responses based on that custom field?
Admin
— Bri Hillmer on 11/20/2015
@Krista: You can create a segment based on any question in your survey. So if you wish to create a segment for each ice cream flavor then you can look at the rest of the questions in your survey in this way.
I hope this helps!
Bri
Documentation Coordinator/Survey Sorceress
SurveyGizmo Customer Support