- Check it out in an example survey!
- Add a survey with this question to your account!
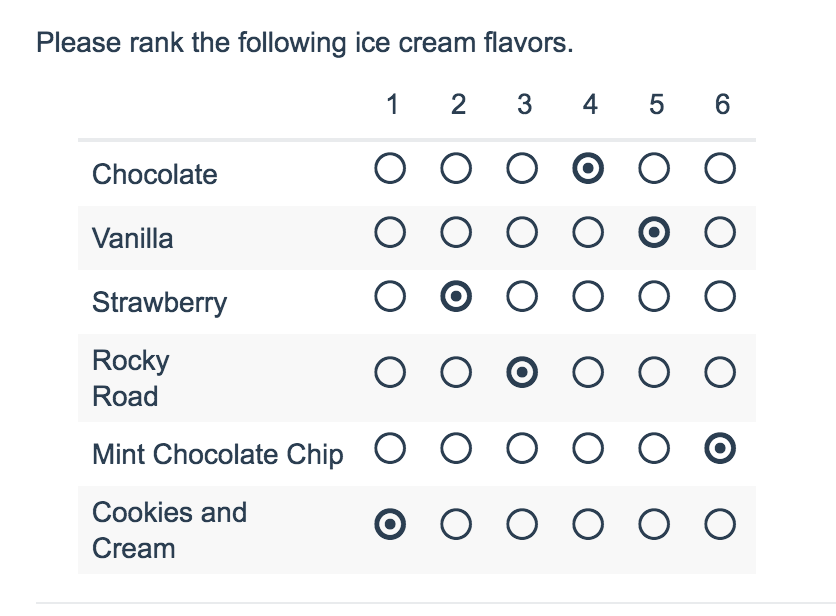
Ranking Grid questions allow respondents to rank a list of items in order, by selecting their numeric rank from a table of radio buttons, where each column is restricted to a single answer across all rows. This question type is designed as a numeric ranking, so you will not be able to put text into the column headers.
When To Use It
Use the Ranking Grid question to allow respondents to rank of list of items first to last. You can also use this question in place of Drag & Drop Ranking question for screen reader accessibility.
Limiting the Number of Items to be Ranked
By default, Ranking Grid questions will create the same number of columns as rows headers. This means that your results will rank each item (row) from highest to lowest.
If you prefer to gather the top 3 ranked items, you can do so by customizing the number of columns in your ranking questions. To do so:
- Edit your question and click the Validation tab.
- Enter the maximum number of columns you would like to display in the Limit answers to field.
- Click Save Question.

Your question should now reflect the number of column headers you indicated.
![]()
Logic
Ranking Grids can be targeted by logic but cannot be used to trigger a follow up question. Rows in a ranking grid cannot be shown/hidden.
Survey Taking
On a desktop and most laptops the Ranking Grid question type looks like so.

When optimized for mobile devices the Ranking Grid question type works a little differently as the small targets in grids are difficult to interact with on mobile devices. Instead respondents will need to click the options in order of their preference.
By default, survey questions show one at a time on mobile devices to prevent the need for scrolling on smaller screens. You can turn off this one-at-a-time interaction if you wish.

Reporting
Standard Report
In the Standard Report Ranking Grid questions report as a Diverging Stacked Bar Chart.

The table will include a row for each item in your Ranking Grid. Each item will have a Rank, Distribution, Score, and No. of Rankings.
- The Rank is assigned by the Score.*
- The Score is computed as described below.
- The No. of Rankings is the number of respondents that ranked that item. This can vary if the question is unrequired or you are limiting the number of items to be ranked.
- Finally, the Distribution is a diverging stacked bar where a shade is assigned to each possible rank (which usually corresponds to the number of items unless you are limiting the number of items to be ranked). At the midpoint, the color of the sections of the bar changes to help you to see where preference starts to fall off for each item. The width of each section is determined by the number of times that option assigned that rank.
*If the scores for multiple items are identical the Rank will be determined based on when the option was added to the question. Items added earlier will be ranked higher in the list.
See additional compatible chart types
Within the Standard Report there are various chart types available for visualizing your data. The below grid shows which of the chart types Ranking Grid questions are compatible with.


See what other report types are compatible
The below grid shows which of the report types Ranking Grid questions are compatible with. If you plan to do some specific analysis within SurveyGizmo this report compatibility chart should help you choose the right question types!
| Report Type | Compatible |
|---|---|
| Standard | |
| Legacy Summary | |
| TURF | |
| Profile | |
| Crosstab | |
| Comparison |
Computing the Score
The score is a weighted calculation. Items ranked first are given a higher value or "weight." The score, computed for each answer option/row header, is the sum of all the weighted values. The weighted values are determined by the number of columns, which is usually the same as the number of rows but can be less if using the option to Limit Ranked Items.
For example, in the report above, because there are 6 options, the weighted sum for an option that was placed in the first position (1) would be worth 6. The table below shows the formula for computing the total rank for each answer option/row header:
| Total Responses | x | Weight | = | |
|---|---|---|---|---|
| Rank 1 Count | x | 6 | = | |
| Rank 2 Count | x | 5 | = | |
| Rank 3 Count | x | 4 | = | |
| Rank 4 Count | x | 3 | = | |
| Rank 5 Count | x | 2 | = | |
| Rank 6 Count | x | 1 | = | |
| + | Total Score (Answer Option X) |
If you had 7 instead of 6 answer options, then answer options chosen as Rank of 1 would be given a weighted value of 7 points, Rank 2 would be weighted 6 points and so on and so forth.
When items are not ranked e.g. there are 4 items, but only 2 are ranked OR if you are limiting the number of items to be ranked, the unranked items are given a score of 0 and the first ranked item is only given a score of 2 and second ranked is given a score of 1.
Exporting
If you'd prefer to look at your ranking data in more individual level or unsummarized format you can do so by exporting your data.
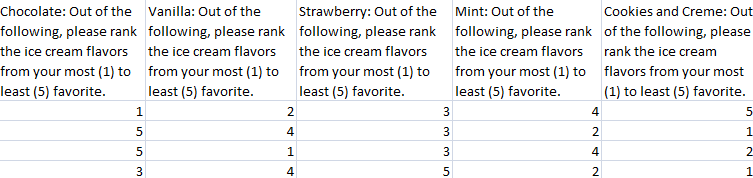
In CSV/Excel exports, each rank item will export as its own column. The column headers will first display the rank item and then the question title. In the row you can see the actual rank selected for each of your answer options in your ranking question. For each response (the row) the value in the cell for your that column or answer option is the rank selected by the respondent.
A Note About Piping Into Ranking Grid Questions
Ranking Grid questions use a weighted score that is based on the number of answer options. Because the number of options will vary when option piping, we discourage piping into a Ranking Grid as this can result in skewed data.
If you wish to pipe into a Ranking Grid, we recommend setting the minimum and max selectable options equal to each other in your source question. This way, each response has the same number of options and the weighted score is computed correctly.
— Mike.cordeiro on 07/28/2020
@Jared: Thank you so much for reaching out to our help page!
Regrettably there is not a built-in way to have this question displayed as it does for the mobile survey taking experience. This may be possible via custom scripting if you or your team have scripting knowledge! Additionally, we do have a Professional Services Team, who specialize in unique one-off builds at an additional cost. The would be able to assist with this moving forward, and can be contacted using the link below:
https://www.surveygizmo.com/professional-services/
I hope this helps!
Mike
Technical Writer
SurveyGizmo Learning and Development
— JShadix on 07/24/2020
Is there a way to use the mobile version of this question of desktop users? Also, I understand that Diverging Stacked Bar Chart is not currently supported as a Result Chart Action, but is there a workaround I could use to display it in my surveys?
Admin
— Dave Domagalski on 11/13/2018
@Pedagogias: Thank you for your question!
I'm afraid that an 'other textbox' is not available for the Ranking Grid question type.
Adding this functionality to the Ranking Grid would require a custom solution - something that our Pro Services team may be able to assist with:
https://www.surveygizmo.com/programming-services/
I'm sorry for the trouble and hope this helps clarify!
David
Documentation Specialist
SurveyGizmo Customer Experience
— Pedagogias on 11/12/2018
Hi! I want to add a other texbox row in my ranking grid question, hoy can i do that? thanks!
Admin
— Bri Hillmer on 05/09/2018
@Hanna.rehome: The Rank Distribution chart is not currently supported in downloads to Microsoft Office products.
I'll be sure to make note of this for our development team as a possible future improvement.
In the meantime, perhaps you can take a screenshot of the chart in the online report and include it in your presentation that as an image?
I hope this helps!
Bri Hillmer
Documentation Coordinator
SurveyGizmo Customer Experience Team
— Hanna.rehome on 05/09/2018
Is there a way to export the rank distribution chat that survey gizmo makes in the report for ranking questions? I'd like to use that visual in my presentation but when I export it only exports the values.
Admin
— Bri Hillmer on 04/19/2018
@Mandylee: Ranking Grids do not have an option add Other-write-in rows, however, I do have a workaround for you.
You can start by using a Radio Button Grid rather than a Rating Grid as they do have an option to do so as discussed in this tutorial:
https://help.surveygizmo.com/help/other-row-headers
Then, you can apply a script that we have documented to make the Radio Button Grid behave like a Ranking Grid (one answer per column). You can find the documented script here:
https://help.surveygizmo.com/help/one-answer-per-column
I hope this helps!
Bri Hillmer
Documentation Coordinator
SurveyGizmo Customer Experience Team
— Mandylee on 04/19/2018
How can I add "Other - Write In" Rows in ranking grid?
Admin
— Bri Hillmer on 12/02/2016
@Giovanna: Yes it sounds like it!
Bri
Documentation Coordinator
SurveyGizmo Customer Experience Team
— Giovanna on 12/01/2016
I used a ranking question but in my question, I indicated that 1 was lowest rank and 8 was highest. Does this mean that I need to read the results backwards?
Admin
— Bri Hillmer on 09/14/2016
@Neil: Very interesting question you are looking ask! It sounds like you need to make a customization to the Radio Button Grid question (which allows for custom column headers) so that it behaves like the Ranking Grid. Here is a tutorial that covers how to set this up:
http://www.surveygizmo.com/s3/2081684/Allow-One-Answer-Per-Column-in-Radio-Button-Grid
I hope this helps!
Bri
Documentation Coordinator/Survey Sorceress
SurveyGizmo Customer Experience Team
— Neil on 09/14/2016
I would like to ask a question like this in my SurveyGizmo survey, but I would like to use custom text for column headers in lieu of numbers. The opening paragraph of this page states that this is clearly not possible with this question. Is there a question type that better accomplishes this?
For context, I want to ask a question where I say "Match this brand with the tagline it uses" and only allow each tagline to be chosen once.
Thanks!
Neil
Admin
— Bri Hillmer on 08/05/2016
@Rafael: This is probably not the best idea as this create a HUGE table that would require a lot of vertical as well as horizontal scrolling. I took a quick look at your survey and it looks like what you have built out with the checkboxes and piping is probably the best solution.
Let us know if you have further questions!
Bri
Documentation Coordinator/Survey Sorceress
SurveyGizmo Customer Support
— Laura on 08/05/2016
How can I use "Common Answer Options" in Ranking Grids? I would like to ask respondents to rate countries and would like to use the pre-populated list of countries in SurveyGizmo. Is this possible?
Admin
— Bri Hillmer on 06/13/2016
@Lparis: Indeed! The 1 is always the highest ranked item.
I hope this helps!
Bri
Documentation Coordinator/Survey Sorceress
SurveyGizmo Customer Support
— Lparis on 06/10/2016
Hello,
Does Survey Gizmo have the ranking system set up a certain way? For example, when someone uses the ranking grid in their survey, is 1 always the most popular/important? Or is this up to the survey creator to decide when making the survey? I want to be sure I'm reading my report properly.
Thank you!
— Tawnee on 08/03/2015
@Jill ; Hi Jill! Thank you so much for checking out our documentation! Although you can use validation to require a certain amount of answer options. what would work best for you would be our Quiz Score Action. :) Check out our awesome tutorial http://help.surveygizmo.com/help/article/link/quiz-score. This will walk you through setting up the action. Let us know if we can help with anything else! Have a great Monday. :)
As always, we are happy to be of service. Have a rocking' day!
Tawnee Torres
Your Rockabilly Rebel support hero :-)
— Jill on 08/02/2015
I'm trying to figure out how to have a question that requires the user to put a list of items in the correct order. Can this ranking grid be set up so that there are "correct answers" (i.e., using the examples above, chocolate must be 1, vanilla must be 3, etc., in order to get the question right)?