- Check it out in an example survey!
- Add a survey with this question to your account!
Drag & Drop Ranking questions allow respondents to rank a list of items by dragging and dropping each item in order of preference.
Looking to use images in your Drag & Drop Ranking Question? Check out our Use Images in Drag & Drop Ranking Tutorial to learn how!
While we provide screen reader messages for this question, it is not easily accessible for respondents using screen readers.
Use the standard ranking question as an alternate accessible version. See Ranking Grid Question Type for more information.
When To Use It
Use Drag & Drop Ranking questions as an interactive way to ask your respondents to rank order a list of items first to last.
Compatibility
- This question is not compatible with IE 8 and below. Use the Ranking Grid question as an alternate accessible version.
- While we provide screen reader messages for this question, it is not easily accessible for respondents using screen readers. Use the Ranking Grid question as an alternate accessible version.
Limiting Items to be Ranked
Drag and Drop Ranking questions are designed to rank all items from the left-hand column into the right. This means that your results will rank each item (row) from highest to lowest.
If you'd prefer to gather the top 3 ranked items, you can do so by limiting the number of answers your question will accept. To do so:
- Edit your question and click the Validation tab.
- Enter the maximum number of answers you would like to accept in the Limit answers to field.
- Click Save Question.

Your question will now only accept the number of answers you indicated. Any additional selections that you drag to the right will not stick.
Customize the Look & Feel
By default the Drag & Drop question takes up about two-thirds of the page and is left-aligned. However, you can customize the layout.
Learn how to use images instead of text as the answer options.
To adjust the overall width
Edit the question and go to the Layout tab. In the Overall Question Width field, enter the pixel width you desire. In most themes, the default width is 410 px. If you are looking to increase the width, enter a higher value for overall question width. If you are looking to decrease the width, enter a lower value for overall question width.

Centering the Drag & Drop Ranking Question
If you are looking to center the entire Drag & Drop Ranking question, you can paste the below CSS in your survey theme. To do so go to the Style tab and scroll to the bottom of the survey preview to access the link to the HTML/CSS Editor. Paste the below CSS code on the Custom CSS tab.
.sg-rank-dragdrop{
margin: auto;
}
Survey Taking
On a desktop and most laptops, the Drag & Drop Ranking question type looks like so.
When optimized for mobile devices the Drag & Drop Ranking question type works a little differently as dragging and dropping on mobile devices is difficult. Instead, respondents will need to click the options in order of their preference.
By default, survey questions show one at a time on mobile devices to prevent the need for scrolling on smaller screens. You can turn off this one-at-a-time interaction if you wish.

Reporting
Standard Report
In the Standard Report Drag & Drop Ranking questions report as a Diverging Stacked Bar Chart.

The table will include a row for each item in your Drag & Drop Ranking question. Each item will have a Rank, Distribution, Score, and No. of Rankings.
- The Rank is assigned by the Score.*
- The Score is computed as described below.
- The No. of Rankings is the number of respondents that ranked that item. This can vary if the question is unrequired or you are limiting the number of items to be ranked.
- Finally, the Distribution is a diverging stacked bar where a shade is assigned to each possible rank (which usually corresponds to the number of items unless you are limiting the number of items to be ranked). At the midpoint, the color of the sections of the bar changes to help you to see where preference starts to fall off for each item. The width of each section is determined by the number of times that option assigned that rank.
*If the scores for multiple items are identical the Rank will be determined based on when the option was added to the question. Items added earlier will be ranked higher in the list.
See additional compatible chart types
Within the Standard Report there are various chart types available for visualizing your data. The below grid shows which of the chart types Drag & Drop Ranking questions are compatible with.


See what other report types are compatible
The below grid shows which of the report types Drag & Drop Ranking questions are compatible with. If you plan to do some specific analysis within SurveyGizmo this report compatibility chart should help you choose the right question types!
| Report Type | Compatible |
|---|---|
| Standard | |
| Legacy Summary | |
| TURF | |
| Profile | |
| Crosstab | |
| Comparison |
Computing the Score
The score is a weighted calculation. Items ranked first are given a higher value or "weight." The score, computed for each answer option/row header, is the sum of all the weighted values. The weighted values are determined by the number of columns, which is usually the same as the number of rows but can be less if using the option to Limit Ranked Items.
For example, in the report above, because there are 6 options, the weighted sum for an option that was placed in the first position (1) would be worth 6. The table below shows the formula for computing the total rank for each answer option/row header:
| Total Responses | x | Weight | = | |
|---|---|---|---|---|
| Rank 1 Count | x | 6 | = | |
| Rank 2 Count | x | 5 | = | |
| Rank 3 Count | x | 4 | = | |
| Rank 4 Count | x | 3 | = | |
| Rank 5 Count | x | 2 | = | |
| Rank 6 Count | x | 1 | = | |
| + | Total Score (Answer Option X) |
If you had 7 instead of 6 answer options, then answer options chosen as Rank of 1 would be given a weighted value of 7 points, Rank 2 would be weighted 6 points and so on and so forth.
When items are not ranked e.g. there are 4 items, but only 2 are ranked OR if you are limiting the number of items to be ranked, the unranked items are given a score of 0 and the first-ranked item is only given a score of 2 and second-ranked is given a score of 1.
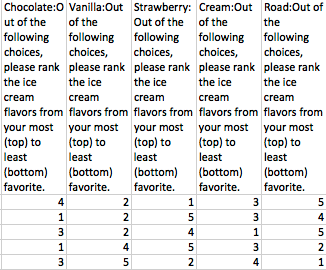
Exporting
If you'd prefer to look at your ranking data in more individual level or unsummarized format you can do so by exporting your data.
In CSV/Excel exports, each rank item will export as its own column. The column headers will first display the rank item and then the question title. In the row, you can see the actual rank selected for each of your answer options in your ranking question. For each response (the row) the value in the cell for your that column or answer option is the rank selected by the respondent.
A Note About Piped and Unrequired Drag & Drop Ranking Questions
Drag & Drop Ranking questions use a weighted score that is based on the number of answer options. Because the number of options that are ranked can vary in option-piped or unrequired questions this can result in skewed data.
If you wish to pipe into a Drag & Drop Ranking question or leave the question unrequired, we recommend setting the minimum and max selectable options equal to each other in your source question. This way, each response has the same number of options and the weighted score is computed correctly.
Admin
— Andrew Sturtz on 12/05/2019
@Donna: Thanks for the question! @MSR had a similar question, check that out below.
If you need additional information, please reach out to support@surveygizmo.com.
Andrew
SurveyGizmo Customer Support Team
— Donna on 12/05/2019
Is it possible to use an "Other (write-in)" category on a ranked drag and drop?
Admin
— Dave Domagalski on 11/22/2019
@Celia: Thank you for your question!
I’m afraid that there is not a built-in feature to pipe only the first rank item into the next question. This is possible but would require a custom scripted solution.
We currently have a documented solution for a related situation at the below link:
https://help.surveygizmo.com/help/drag-and-drop-show-when
Perhaps this can help with your scenario?
David
Technical Writer
SurveyGizmo Learning & Development
— Julie on 11/21/2019
Hi, is it possible to pipe the "first rank" option into the next question?
Admin
— Dave Domagalski on 09/16/2019
@Survey-asia: Thank you for your question!
I’m afraid that it is not currently possible to give the same rank to multiple items with the same score. Similarly, there is not a setting to remove the 'rank distribution' chart from the reporting.
I will share this feedback with our Product team as a potential future enhancement to the product.
I’m sorry for the trouble!
David
Technical Writer
SurveyGizmo Learning & Development
— Survey-asia@amiculum.biz on 09/16/2019
Is there a way to give items with the same score the same rank? Eg overall rank 1, 2, 3, 3, 5, 6 etc?
Also, is there a way to remove 'rank distribution' from the report?
Admin
— Bri Hillmer on 01/18/2019
@Thomas: I did a little testing and am seeing what you describe. This is definitely a bug which I've reported to our engineering team. As I do not have a timeline on a fix the only workaround I can think of is to use the minimum answered require validation and set it equal to your max to ensure your responses are scored properly.
Sorry for the trouble!
Bri Hillmer
Documentation Coordinator
SurveyGizmo Customer Experience Team
— Thomas on 01/18/2019
Is there the possibility to give answers a fix score? For instance: if I set the answer limitation at 3, if a person only selects 1 item, I would give a score of 3? And for 2 anwers 3 and 2?
Now it is still diffitcult to see what is the most important item if people only select 1 item of the list. If 30 people only select the same 1 answer, the score is 30. But if 10 people select another item (and 2 other items), there score is also 30, despite the first item selected by 30 people is way more important.
Admin
— Bri Hillmer on 09/25/2018
@Brian.feltz: What you describe is not available out of the box but you could achieve it with scripting. We don't have an exact script for your use case documented but we have something pretty similar documented. If you want to try your hand a scripting something like this you can review a similar script here:
https://luascript.surveygizmo.com/help#show-pages-based-off-a-drag-drop-ranking
Alternatively, our Programming Services Team can script a solution for you if you are interested:
https://www.surveygizmo.com/programming-services/
I hope this helps!
Bri Hillmer
Documentation Coordinator
SurveyGizmo Customer Experience Team
— Brian.feltz on 09/25/2018
It looks like there's no way to conditionally show/hide response options in a ranking question, is that correct? That's a bummer. I have an importance rating question with a long list of items. I then want participants to rank the items they rated at least somewhat important. Any way to pull that off?
Admin
— Dave Domagalski on 08/22/2018
@Ken: Thank you for your question!
I'm afraid that there is not a built-in option to force the mobile version of the drag & drop ranking question for desktop users.
This may be worth exploring as a custom solution with our Programming Services team if you are interested:
https://www.surveygizmo.com/programming-services/
I'm sorry for the trouble!
David
Documentation Specialist
SurveyGizmo Customer Experience
— Ken on 08/22/2018
Is there a way to force the desktop users to get the same version of the question (where you click the options in the order you prefer) as mobile users get? NOT the one-at-a-time setting, but actually forcing the separate, mobile version of the question?
Admin
— Bri Hillmer on 08/01/2018
@Mbigham: The Drag & Drop Ranking question is not available for filtering like you describe I'm sorry to say.
Bri Hillmer
Documentation Coordinator
SurveyGizmo Customer Experience Team
— Mbigham on 08/01/2018
Can I filter an entire report on a drag and drop answer? For example, my drag and drop lists voluntary termination reasons and I would like to create a report of all values where one of the drag and drop answers was "Personal Reasons". I am trying to filter but I keep getting 0 results.
Admin
— Bri Hillmer on 07/05/2018
@MSR: There is not an option for providing an other write in field to Drag & Drop Ranking.
You may want to enable comments on the Drag & Drop question and use that field to gather an other write in response. Here is a tutorial on the comments feature:
https://help.surveygizmo.com/help/comments
I hope this helps!
Bri Hillmer
Documentation Coordinator
SurveyGizmo Customer Experience Team
— MSR on 07/05/2018
HI there, is other(write -in) an option for drag and drop ranking. We have our list but want to give the respondents and option to write their own as well. Thanks.
Admin
— Bri Hillmer on 06/28/2018
@Matt: I tested this out and confirmed this is a bug. I've reported this to our development team to fix. Thank you for letting us know!
Bri Hillmer
Documentation Coordinator
SurveyGizmo Customer Experience Team
— Matt on 06/28/2018
It seems that when the options are piped from a question where the text is hyperlinked, the hyperlink carries over to the Drag and Drop Rankings options and when clicked from the Drag and Drop question, the option disappears from the list to move over to the rankings section.
Admin
— Dave Domagalski on 05/23/2018
@Trevor: Thank you for exploring SurveyGimzo documentation content!
I'm afraid that the Drag & Drop Ranking question does not support the fixed answer option setting.
Achieving this functionality within the Drag & Drop question would require a custom solution via JavaScript.
I'm sorry for the trouble!
David
Documentation Specialist
SurveyGizmo Customer Experience
— Trevor on 05/23/2018
Is there any way to fix the position of a given item in the list while randomizing? As can be done with most other question types?