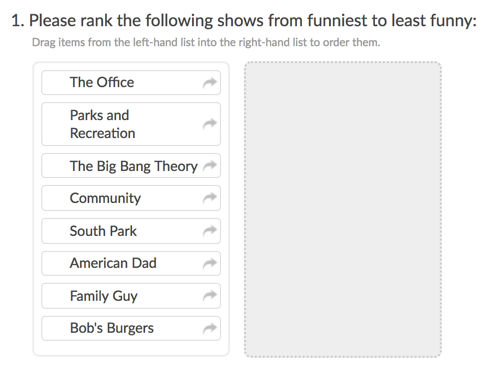
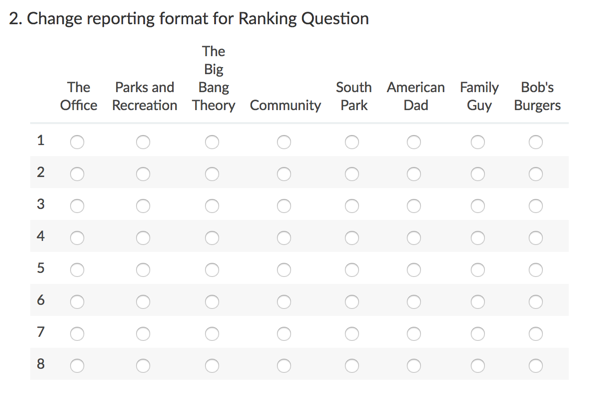
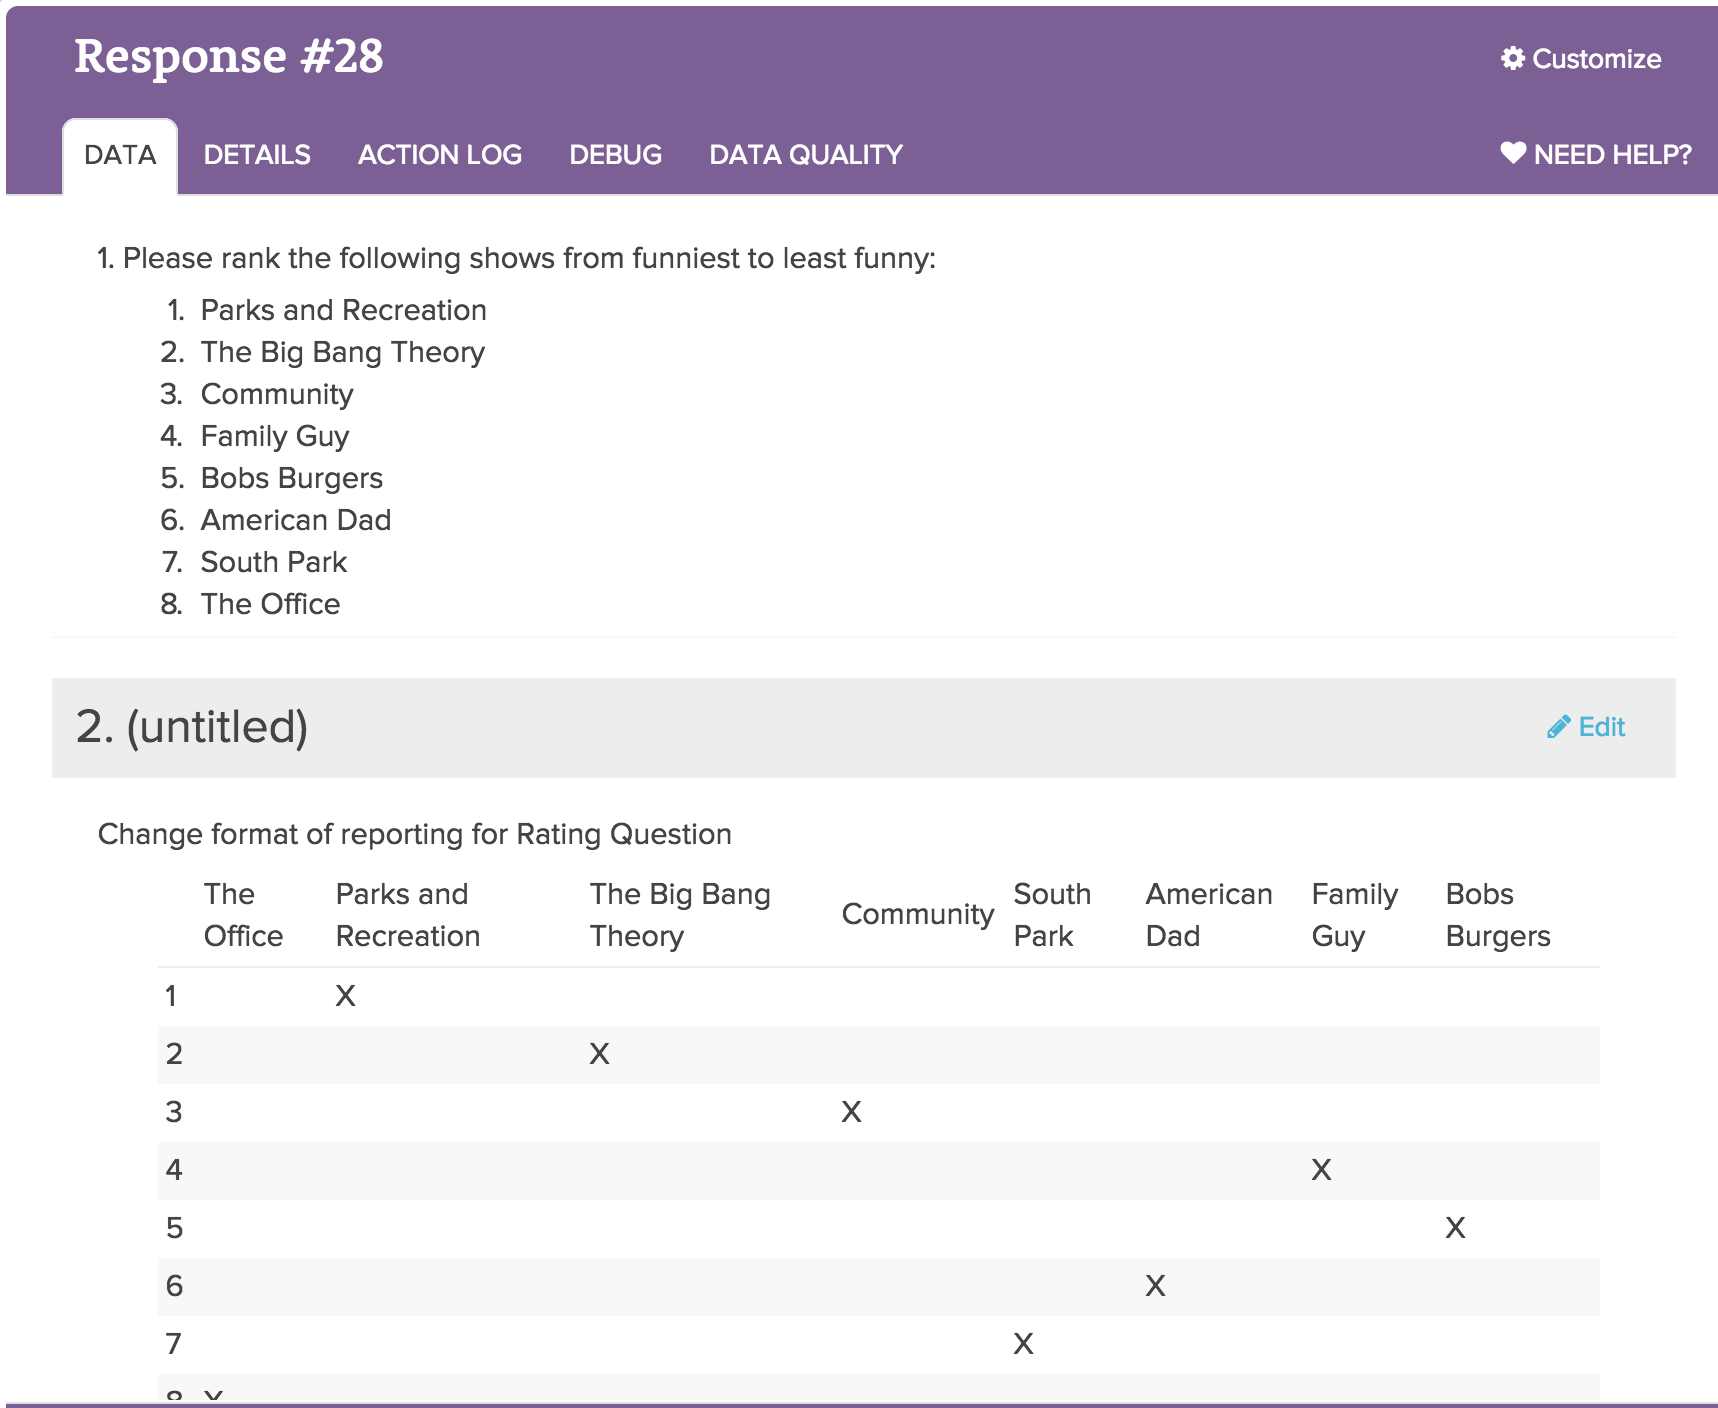
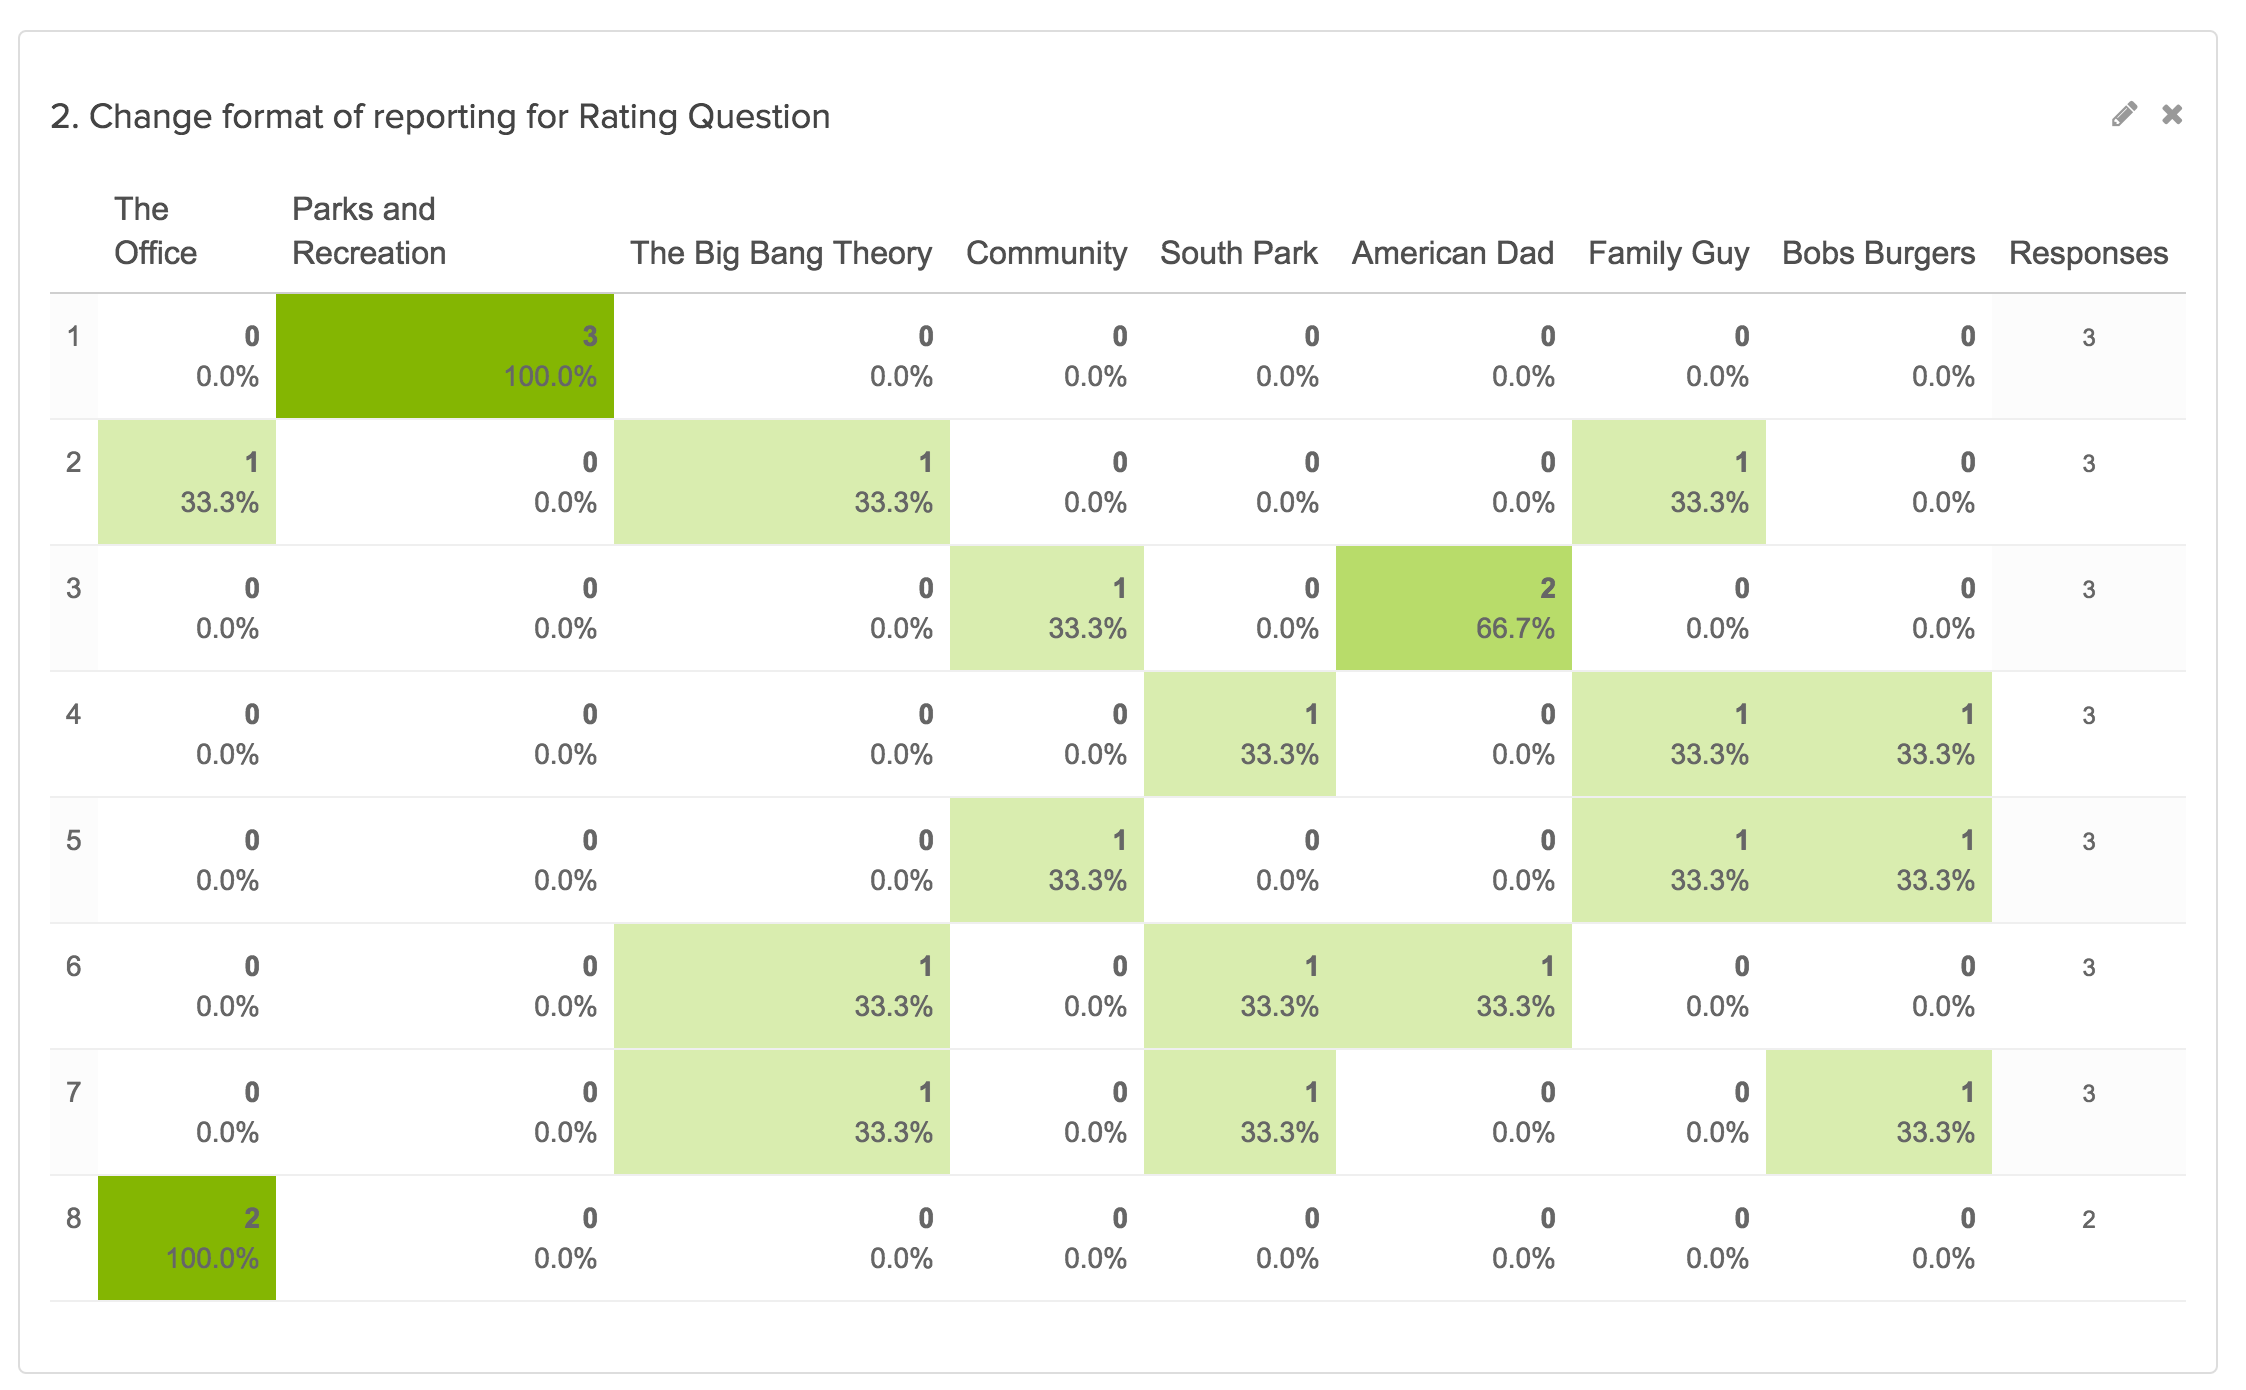
Both our Drag & Drop Ranking question and our Ranking Grid will report and export on the row headers for each question. The report data of an aggregated score and a corresponding rank for each row header/option. Some users are more interested in focusing on the rank and how often each row header or option is selected for each rank. This script will transform the data into a hidden Radio Button Grid to accomplish the rank aggregation for each row header/option.
Check it out the example survey and the results in a example report!
OR
Add this survey to your account!
We'll be using the following SurveyGizmo features and functions in this example:
Setup
Start by building your Drag & Drop Ranking or Ranking Grid question.

On a later page, build a Radio Button Grid question with the row headers from your Drag & Drop Ranking or Ranking Grid question as column headers and the ranking score – 1 through however many answer column headers you added – as row headers.

On the same page but preceding the Radio Button Grid question, add a Custom Script action and paste the below code.
ranking_qID = 2 --qustion ID of the drag and drop/ranking grid
recode_qID = 3 --question ID of the radio button grid into which we are recoding, column reporting values should be exactly the same as ranking question row headers, row titles numeric sequential
next_pageID = 2 --ID of the next page to jump to so respondents do not see page with the radio button ngrid

source_options = getquestionoptions(ranking_qid, 'Reporting')
source_answers = getvalue(ranking_qid)

source_by_rankings  = {}

for key,value in pairs (source_answers) do
   source_by_rankings[value] = source_options[key]

end

target_question = array_flip(gettablequestiontitles(recode_qid))
--row title => qid

for rank,option in pairs (source_by_rankings) do

rank = tonumber(rank)

setvalue(target_question[rank], option)

end

jumptopage(next_pageid)
Required Customizations
In the script above you will need to customize variables highlighted in yellow in order to make the script work the way you'd like. Not sure how to find these? Check out our How to Find IDs Tutorial to learn how!
ranking_qID - The question ID of your original Drag & Drop Ranking or Ranking Grid question.
recode_qID - question ID of the radio button grid into which we are recoding, column reporting values should be exactly the same as ranking question row headers, row titles numeric sequential
next_pageID - The page ID for the next page to jump to so that respondents do not see the page with the Radio Button Grid.
Test and Run a Report and an Export
You'll need to manually record several test responses as Custom Script actions are not triggered by the test data generator.
Start by checking out your Individual Responses under Results > Individual Responses. Confirm that the data from your Ranking question and your Radio Button Grid Question corresponds.

Next, run a Standard Report to confirm that your data is in the format you require.

Finally, if you plan to use the raw data exports. You'll want to confirm that this data is also formatted they way that you need it to be.
Scripting and Other Custom Solutions
We’re always happy to help you debug any documented script that is used as is. That said, we do not have the resources to write scripts on demand or to debug a customized script.
If you have customization ideas that you haven't figured out how to tackle, we're happy to be a sounding board for SurveyGizmo features and functionality ideas that might meet your needs. Beyond this, check out our Professional Services; these folks have the scripting chops to help you to achieve what you are looking for!
Admin
— Dave Domagalski on 03/12/2018
@Liz: Thank you for your note!
I'm sorry for the trouble and inconvenience with this workaround. I will certainly make a note with our Development team regarding providing some more options for reporting on these ranking questions.
In the meantime, the Standard Report can be downloaded to both Word and Excel via the options described here:
https://help.surveygizmo.com/help/report-downloads
I hope this helps!
David
Documentation Specialist
SurveyGizmo Customer Experience
— Liz on 03/11/2018
These workarounds are tough if you're not a programmer! How about just giving us the ability to change the type of report or better yet, why can't it just download into word or excel? Thanks.
Admin
— Dave Domagalski on 03/21/2017
@Amy: Thank you for this question!
A total response count can be included for the Drag & Drop question.
To do this, you will need to create a Standard Report and access the report's 'Overall Options' as described here:
https://help.surveygizmo.com/help/overall-versus-element-specific#standard-report-overall-options-vs-layout-options
Next, click on Layout and locate the Statistics Table checkbox. Select the 'Total Responses' option and click 'Done' on the bottom right to apply the setting.
I'm sorry for the trouble! I hope this helps clarify.
David
Documentation Specialist/Survey Explorer
SurveyGizmo Customer Experience