Standard Report: Diverging Stacked Bar Chart
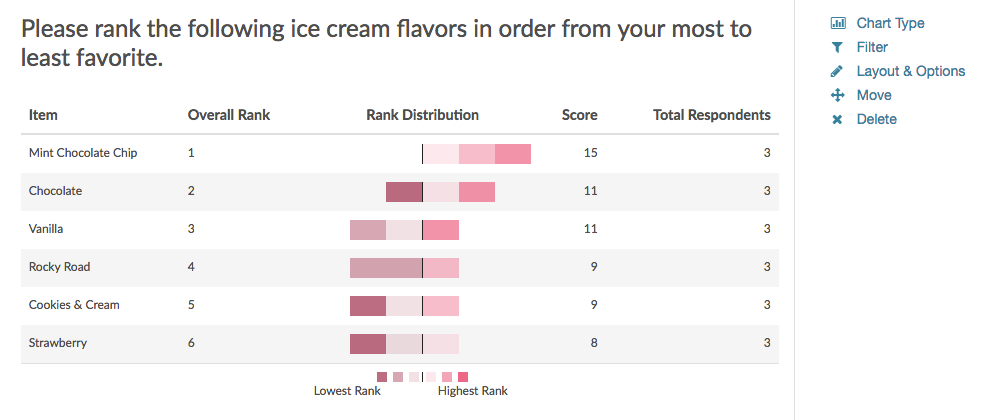
The Diverging Stacked Bar Chart is used to report on Drag & Drop Ranking questions and Ranking Grid questions.
The table will include a row for each item in your Drag & Drop Ranking question. Each item will have a Rank, Distribution, Score, and No. of Rankings.
- The Rank is assigned by the Score.
- The Score is a weighted calculation. Check out our How is the Score Computed Tutorial to learn more.
- The No. of Rankings is the number of respondents that ranked that item. This can vary if the question is not required or you are limiting the number of items to be ranked.
- Finally, the Distribution is a diverging stacked bar where a shade is assigned to each possible rank (which usually corresponds to the number of items unless you are limiting the number of items to be ranked). At the midpoint, the color of the sections of the bar changes to help you to see where preference starts to fall off for each item. The width of each section is determined by the number of times that option assigned that rank.
Available Options for Diverging Stacked Bar Charts
There are a number of options available for diverging bar charts.
Filter
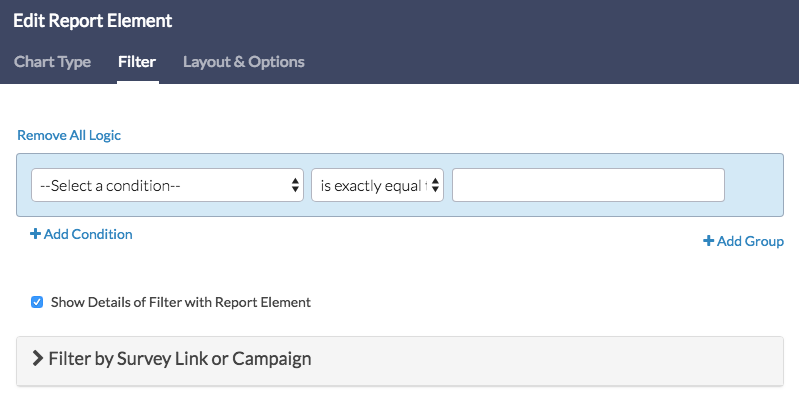
First, if you wish to filter the data that displays for an individual diverging bar chart, click Filter to the right of the element and use the logic builder. Learn more about filtering an individual element.
- If you wish to display the specific details of your filters below your chart check the Show Details of Filter with Report Element checkbox below the logic builder.
- You will also see an option to filter this element by Survey Link or Campaign. This filter option will allow you to only include data in this element that was collected via a specific link (or links).

Layout & Options Tab
To explore even more options, review the settings available within the Layout & Options section.
Answer Options
You can choose to exclude any of the below statistics in the bar chart.
- Rank
- No. of Rankings
- Score
Answer Option Names
- By default, the Original Option Title displayed to survey respondents will display in your report.
- Toggle to Reporting Value if you wish to display this instead.

Admin
— Bri Hillmer on 10/11/2017
@Janice,
You can change these via our Text & Translations tool. To do so, go to the survey in question and click Tools > Text & Translations. Select the language for which you wish to change the text of these fields and then go to the reports tab. Then simply search for each phrase and click edit to change the text.
I hope this helps!
Bri Hillmer
Documentation Coordinator
SurveyGizmo Customer Experience Team
— Janice on 10/10/2017
When downloading this report to Word or PPT, the headings change to overall rank, item, rank distribution, score and total respondents. Is there a way to change this in the actual report prior to downloading it?
Admin
— Bri Hillmer on 11/27/2016
@Liz: I was able to get the diverging stacked bar chart to download to PDF though not for Word or Power Point.
I'm not surprised that this is not downloading to Word or Power Point as it is a custom chart that might not be compatible with Office. I will check with our development team to see if this can be included in Word and Power Point downloads!
Bri
Documentation Coordinator
SurveyGizmo Customer Experience Team
— Liz on 11/24/2016
I like the look of this chart; however, when I download the report, the distribution column is missing. How can I get it to show?