
Longitudinal reporting allows you to view data for your survey questions over time. Using longitudinal reporting you can get a sense for data trends in your longer running surveys.
Setup
- Within your Standard Report, locate a compatible question element.
- Click the Chart Type option to the right of the chart.
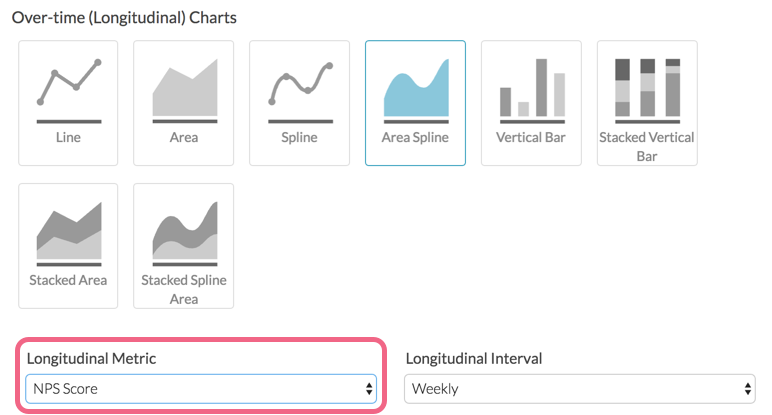
- Select an available chart from the Over-Time (Longitudinal) Charts section of the Chart Types.

- Select the desired Longitudinal Metric that you want to plot. Longitudinal charts will default to show the option counts.
 The following Longitudinal Metrics are available:
- Option Count (default) - plots a data point for each answer option of the question
- NPS® Score (NPS Question only) - plots the score calculated when using the NPS question
- Sum* - plots the Sum - computed by multiplying the number of responses for each option by its numeric reporting value and summing - Learn More!
- Average* - plots the Sum divided by the Total Responses (great option for showing over-time changes for rating questions such as Likert Scales)
- Min* - plots the minimum value selected across all responses
- Max* - plots the maximum value selected across all responses
- Standard Deviation* - plots the standard deviation - a measure of variation
- Variance - plots variance which measures how far a set of (random) numbers are spread out from their mean
- Total - plots the total responses to the question
- Hidden - plots the total responses that did not answer the question regardless of logic conditions that prevented the question from being seen
- Skipped - plots the total responses who saw the question but elected to move past without answering (question must not be required)
*Numeric Reporting Values are required.
Learn more about Statistics within the Standard Report by visiting the documentation.
- Customize the Longitudinal Interval. Longitudinal charts will default to display on a weekly basis. The following intervals are available:
- Daily
- Weekly
- Monthly
- Annual


 The following Longitudinal Metrics are available:
Available Longitudinal Charts
The following longitudinal charts are available for charting your data over-time within a Standard Report.
Line

Area

Spline

Area Spline

Vertical Bar

Stacked Vertical Bar

Stacked Area

Stacked Spline Area

Available Question Types
- Radio Buttons
- Dropdown Menu
- Checkboxes
- Net Promoter Score
- Rating (Likert Scale)
- Image Select (Single and Multi)
- Cascading Dropdown Menu
FAQ
How is longitudinal reporting different than segmenting?
Longitudinal reporting is very similar to segmenting in that the data is grouped. You can even create date-based segments, however using the longitudinal charts is much more efficient. You also have the added benefit of all of these awesome chart types!
Further, if you use the longitudinal charts you can further segment your data such that you can see trends over time and how they differ among groups that you specify!
How do I set up a longitudinal survey?
The above reporting options are designed to report on the data from an ongoing survey over time. If you need to create a longitudinal survey (e.g. a pre- and post-test survey or a diary survey) check out the below tutorials:
Net Promoter, Net Promoter System, Net Promoter Score, NPS and the NPS-related emoticons are registered trademarks of Bain & Company, Inc., Fred Reichheld and Satmetrix Systems, Inc.
Admin
— Bri Hillmer on 02/27/2017
@Sean.mcnally: We have not built out the ability to use averages instead of distributions yet it's a great idea! I will pass this along to our development team as a possible future improvement!
Thanks for your feedback!
Bri
Documentation Coordinator
SurveyGizmo Customer Experience Team
— Sean.mcnally on 02/27/2017
Is there a way to show the mean score in the time series rather than the distribution?
Admin
— Dave Domagalski on 02/06/2017
@Sean.mcnally: Thank you for exploring our documentation content.
The Longitudinal Reporting options are available with SurveyGizmo's new Account Licenses. I'm afraid, these charts are not available via Legacy Plans.
If you do have access to these reporting options with your current account, there are only certain question types that are compatible. These are listed in the above article under:
https://help.surveygizmo.com/help/standard-report-longitudinal-reporting#available-question-types
I hope this helps clarify!
David
Documentation Specialist/Survey Explorer
SurveyGizmo Customer Experience
— Sean.mcnally on 02/05/2017
I can't see any over-time charts in my reporting options. Are there only certain questions or set-ups that show these charts?