There are a number of statistics that can be included in your Standard Report. Once added, statistics are available for most questions within the report and are presented as a table below the question.
Available Statistics
The following statistics are available within the Standard Report:
Please note, many of the below statistics require numeric Reporting Values.
- Sum - The sum is computed by multiplying the number of responses for each option by its numeric reporting value and summing. Available for questions with numeric reporting values.
- Average* - Average is the Sum divided by the Total Responses. Available for single select questions with numeric reporting values.
- Min - The minimum value selected across all responses. Available for questions with numeric reporting values.
- Max - The maximum value selected across all responses. Available for questions with numeric reporting values.
- Standard Deviation - Standard deviation is a measure of variation. Available for questions with numeric reporting values.
- Total Responses - Total responses to the question.
- Hidden Count - Total responses that did not answer the question regardless of logic conditions that prevented the question from being seen.
- Skipped Count - Total responses who saw the question but elected to move past without answering (question must not be required).
*If you are using a Not Applicable answer option in your survey, please note the below information:
- If your question contains a Not Applicable answer option and you have applied a numeric Reporting Value, the NA option will be included when calculating the average.
- If a non-numeric reporting value has been defined, the NA option will not be included when calculating the average.
- If you choose to not show the Not Applicable answer option in the Standard Report, the NA option will not be included when calculating the average.
Add Statistics Table to All Questions
Statistics can be added to all compatible non-grid questions via Report Options > Layout. Learn about the many settings available via Report Options.
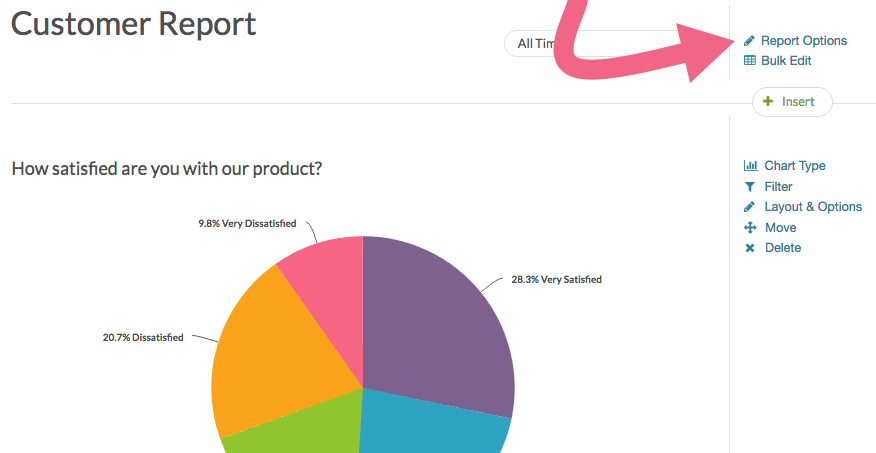
After accessing the Report Options, select Statistics Table. All of the individual metrics that are available will be selected by default. Feel free to pick and choose only those that you need by de-selecting any metrics that you don't want to include. Click Save to apply your settings.
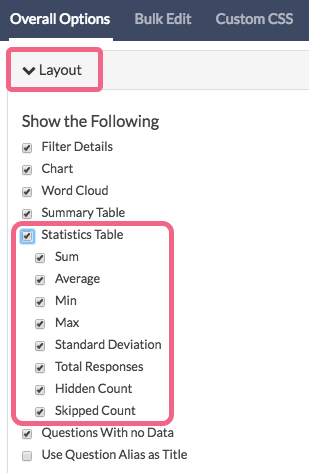
If you have chosen to add all available statistics, the following statistics table will be included below your response table:
Add Statistics Table to Specific Questions
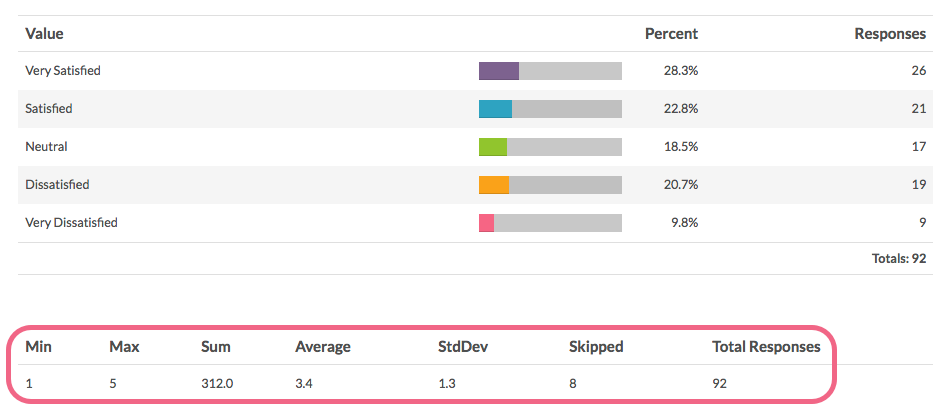
If you wish to customize the statistics shown on a question-by-question basis, go to the question in your report and click Layout & Options to edit.
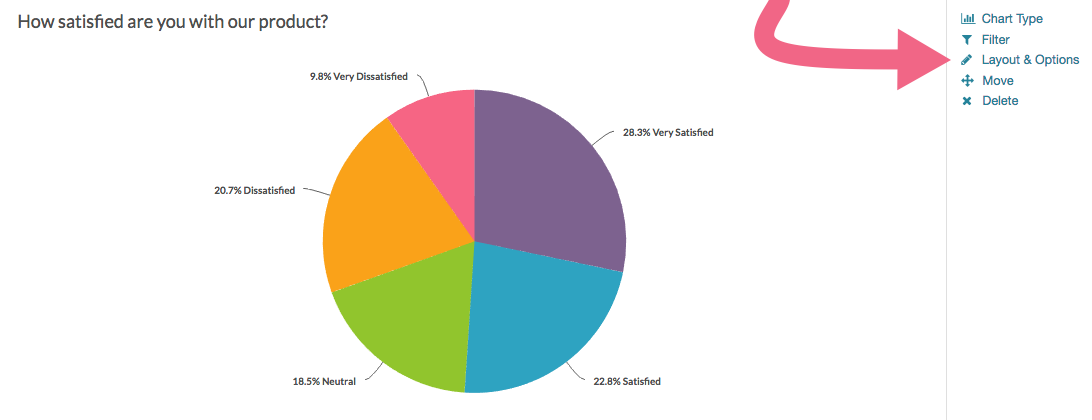
Within Question Options select the statistics options you wish to include or exclude and click Save. The options here will be the same as the ones available via Report Options.
Available Statistics for Grid Questions
The following statistics are available for Grid Questions:
Please note, some of the below statistics require numeric Reporting Values for the column headers.
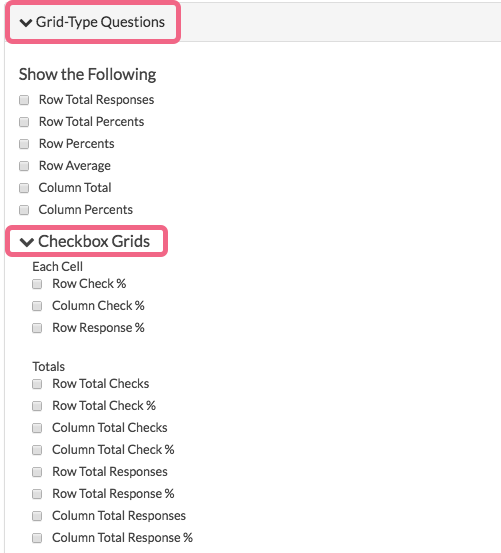
- Row Total Responses - Available for Radio Button Grids, Checkbox Grids, Dropdown Menu List, Dropdown Menu Grid, Textbox Grid.
- Row Total Percents - Available for Radio Button Grids, Checkbox Grids (called Row Total Response % for Checkbox Grids).
- Row Percents - Available for Radio Button Grids, Checkbox Grids (called Row Response % for Checkbox Grids).
- Row Average - Available for Radio Button Grids and Dropdown Menu List (must have numeric reporting values).
- Column Total - Available for Radio Button Grids, Dropdown Menu List, Dropdown Menu Grid, and Checkbox Grids (called Column Total Responses for Checkbox Grids).
- Column Percents - Available for Radio Button Grids, Dropdown Menu List, and Checkbox Grids (called Column Total Response % for Checkbox Grids).
- Row Check % - Available for Checkbox Grid only.
- Column Check % - Available for Checkbox Grid only.
- Row Total Checks - Available for Checkbox Grid only.
- Row Total Check % - Available for Checkbox Grid only.
- Column Total Checks - Available for Checkbox Grid only.
- Column Total Check % - Available for Checkbox Grid only.
Visit the Radio Button Grid or Checkbox Grid tutorials for detailed explanations of the above statistics.
Add Statistics to Grid Questions
Statistics can be added to all compatible grid questions via Overall Options. Click on the Grid-Type Questions section and make your selections from the available options.
Specific options are available for Checkbox Grids via the Checkbox Grid section.
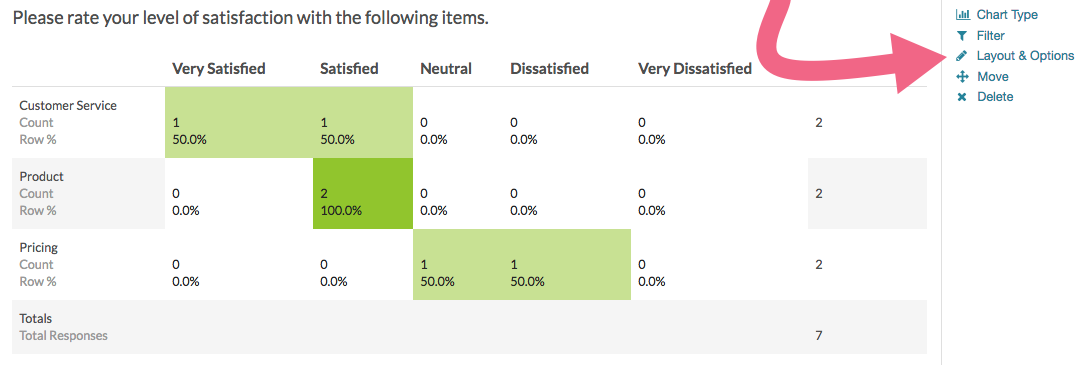
The same grid statistics are available via individual grid questions by clicking the Layout & Options link associated with a specific grid question.
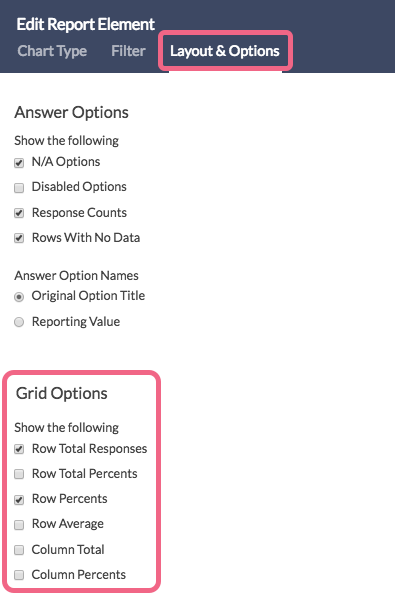
Scroll down to the Grid Options section and check the options that you wish to include. Note that additional statistics are available for Checkbox Grids.
 A Radio Button Grid question with all Grid Options selected appears as follows within the report:
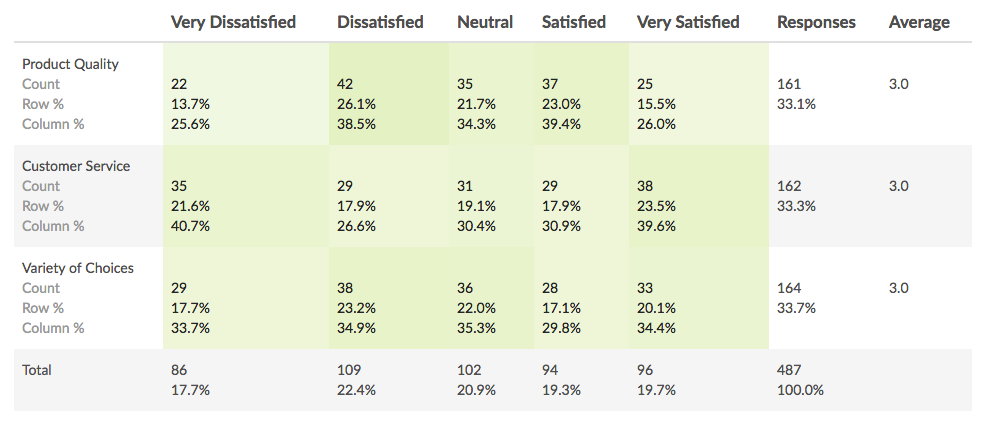
Statistics are included in each grid cell; row and column totals are available to the fight and below the grid respectively.
Admin
— Dave Domagalski on 04/16/2018
@Gemma: Thank you for your question.
I'm afraid that there is not a means for displaying exactly the statistic that you are looking for.
Having said that, the Standard Report offers an 'Email Campaign Statistics' element that is worth exploring:
https://help.surveygizmo.com/help/email-campaign-statistics
I hope this helps!
David
Documentation Specialist
SurveyGizmo Customer Experience
— Gemma on 04/16/2018
Is it possible to show response count as a percentage of people eligible to take the survey? For example, if I send a survey out to 400 people and I get 40 responses, can I get a report to show that as a 10% turnout?