Within Reports averages can be computed for all single-select question types; this includes:
- Radio Buttons
- Radio Button Grids (Row and Column Averages)
- Dropdown Menus
- Single Image Select questions
- Rating (Likert Scale)
- Slider
- Slider List (for each row)
- Star Rating (per table cell).
While some of these questions automatically report averages (Slider, Slider List and Star Rating), the key to computing averages for many of these question types is to specify numeric reporting values that the tool can then use to compute the average.
Learn how to define your own reporting values.
Standard Report
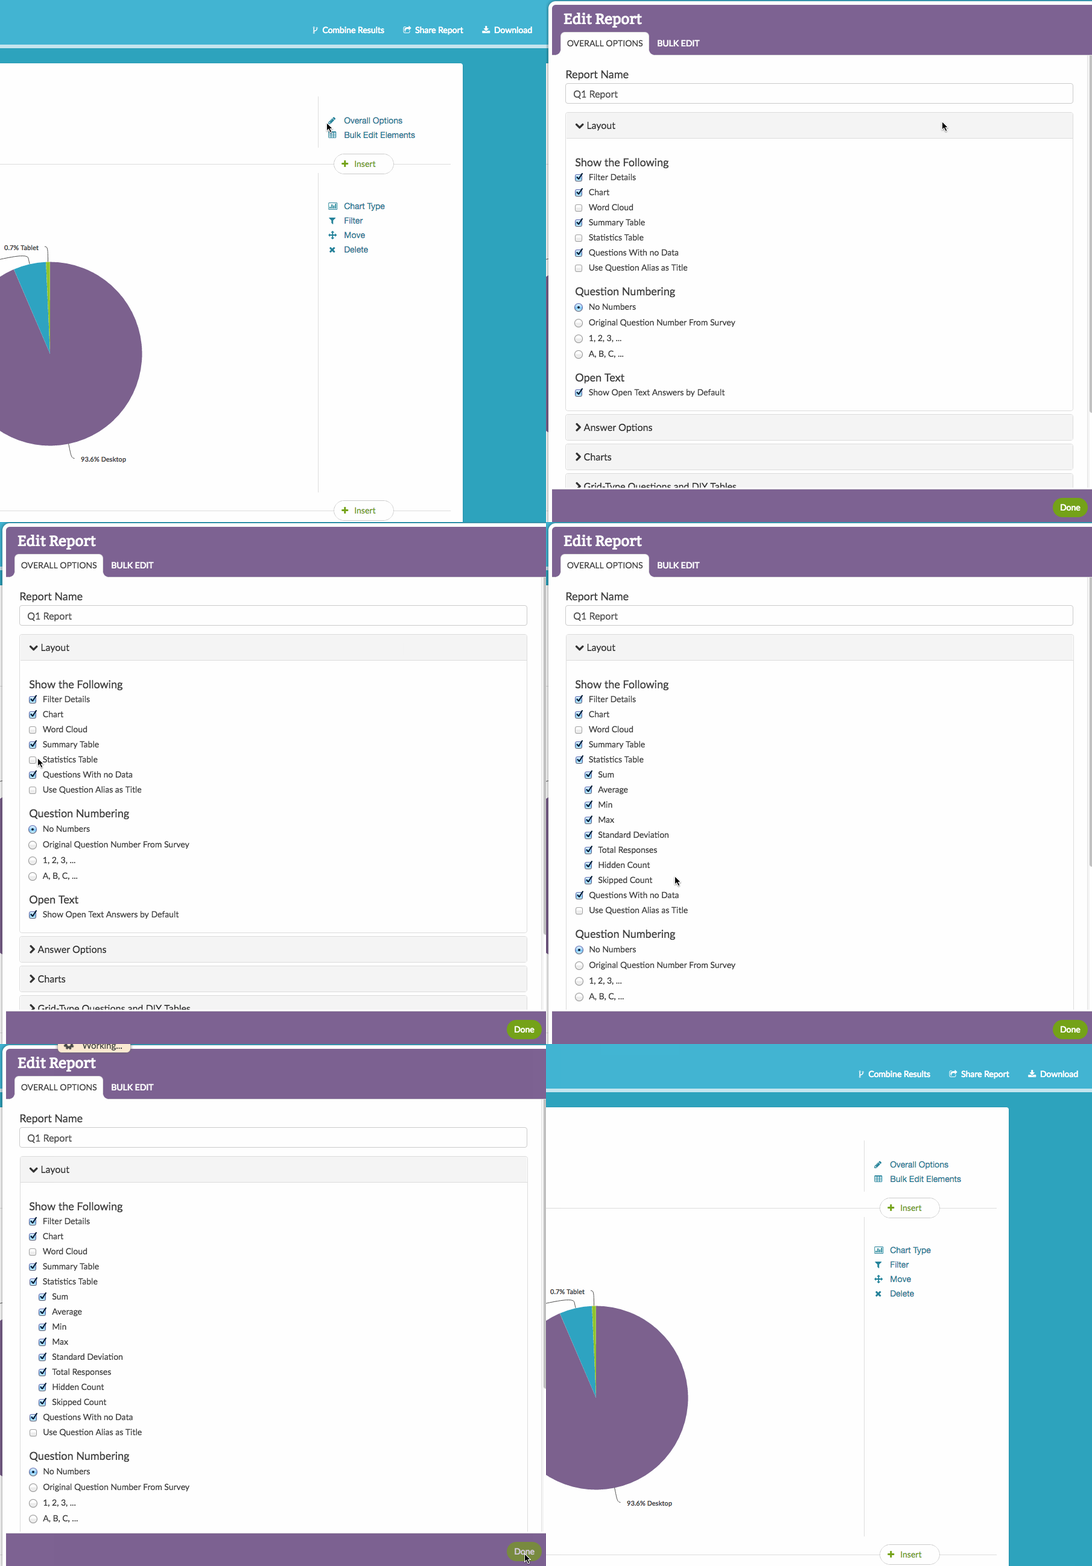
To turn on the statistics table for all questions in a Standard Report go to Report Options > Layout and check the option for the Statistics Table.

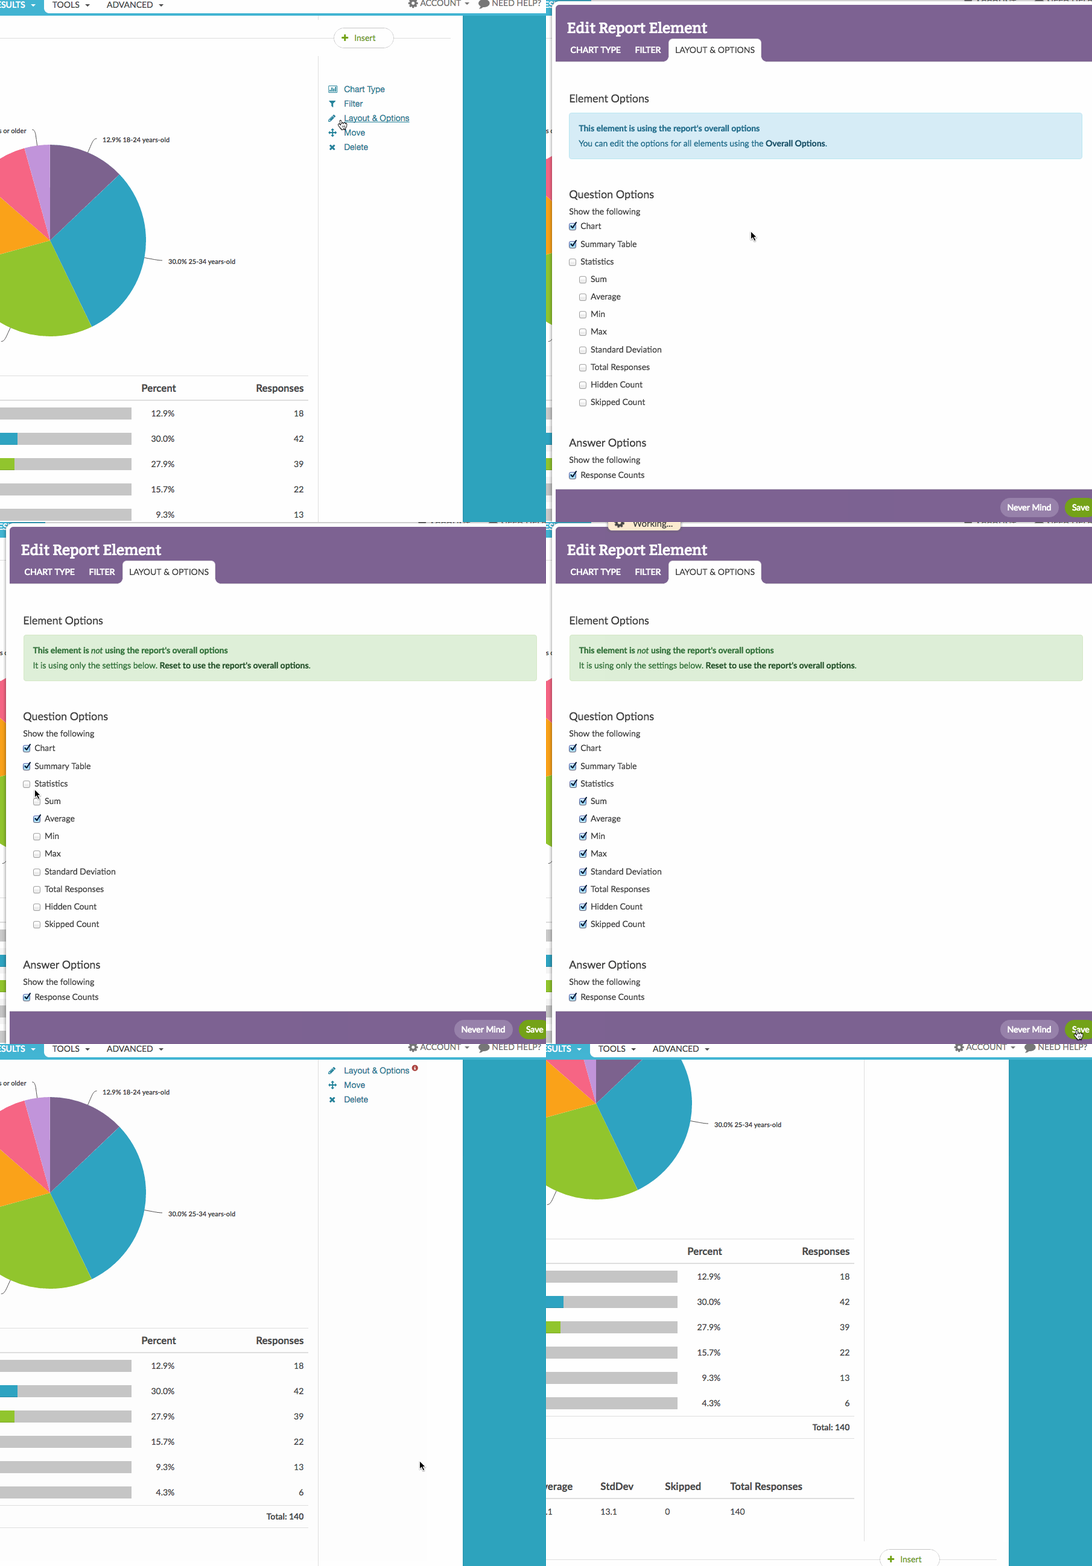
To turn on averages on a question-by-question basis, click Layout & Options to the right of the chart and scroll to the Question Options to select Average and any other statistics you wish to show. Last, click Save.

Row and Column Averages
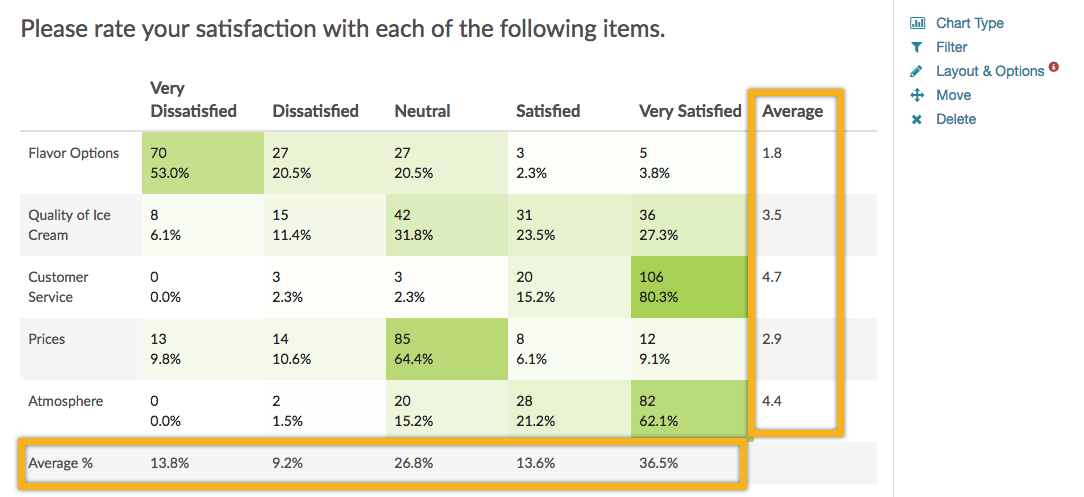
Both column and row averages are available in the reporting of the Radio Button Grid question type. If you are using a scale-type answer set in your columns, this is a great way to quickly scan your rows to get a sense for the highest or the lowest rated row overall.
The average for all table rows in the lower right corner is the average of all rows together.
To turn on Grid Averages you'll need to set up numeric reporting values. Then, create or edit a Standard Report and click the Layout & Options link to edit your Radio Button Grid question. Scroll to the Grid Options section and check the option for Row Average and/or Column Percents.

Legacy Summary Report
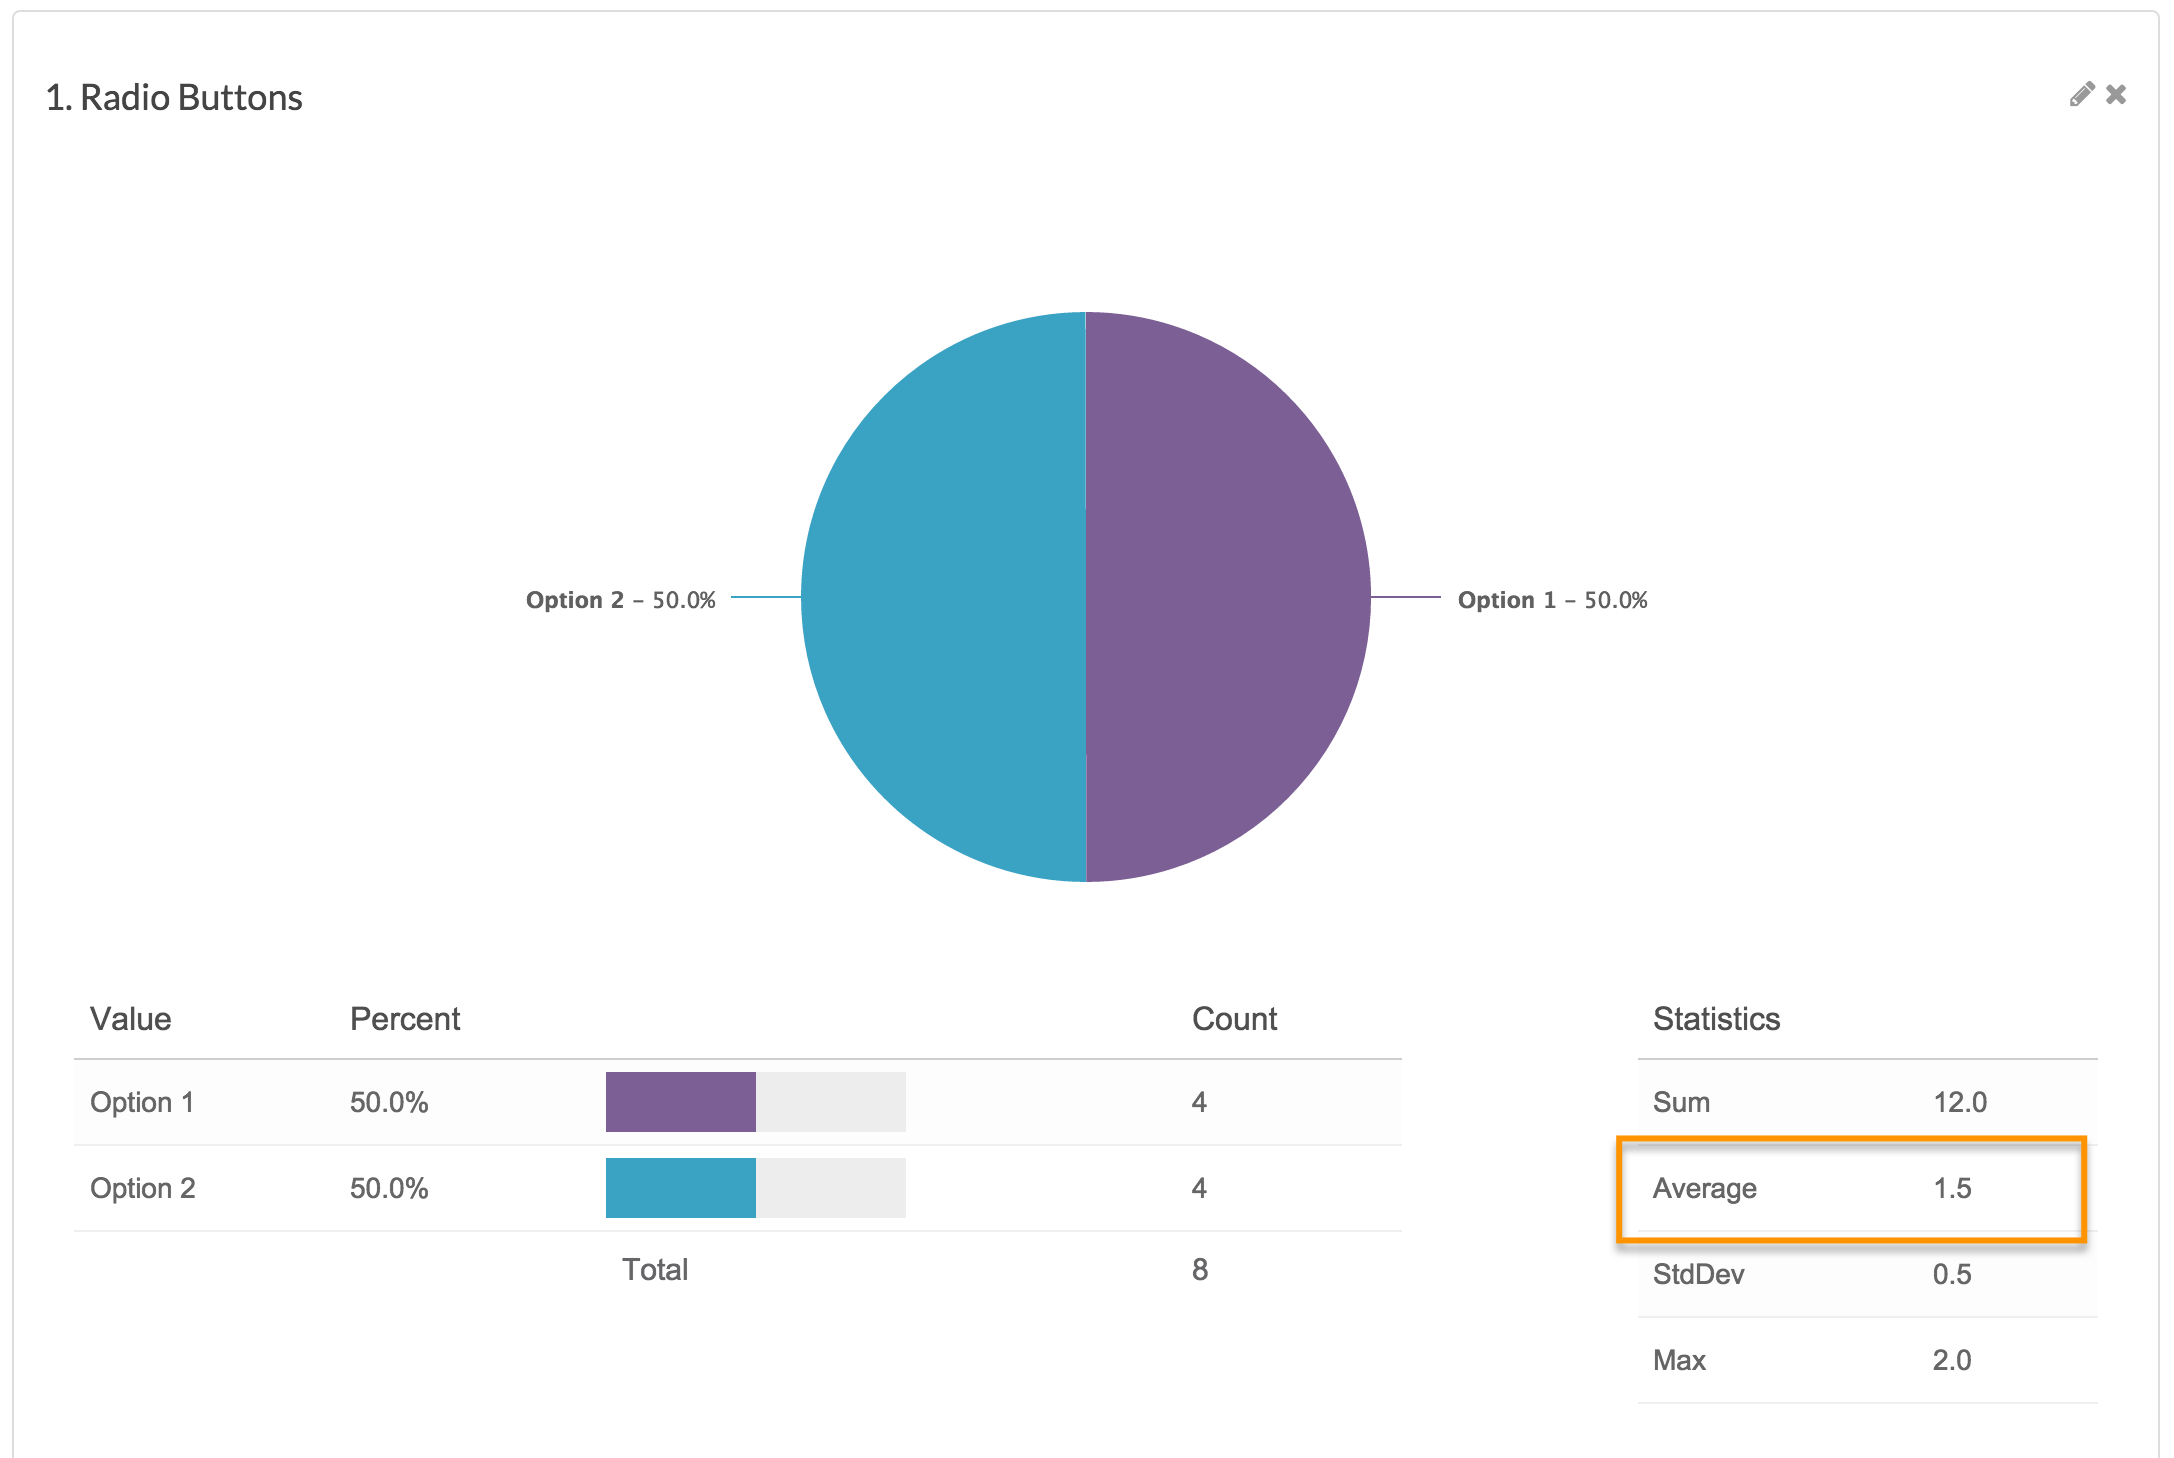
A new Legacy Summary Report will automatically include an Average in the Statistics table to the right of the question.

Row and Column Averages
Both column and row averages are available in the reporting of the Radio Button Grid question type. If you are using a scale-type answer set in your columns, this is a great way to quickly scan your rows to get a sense for the highest or the lowest rated row overall.
The average for all table rows in the lower right corner is the average of all rows together.
To turn on Grid Averages you'll again need to set up numeric reporting values. Then, create or edit a summary report and click Customize Report. On the Stats tab check Show Averages for Table Rows and/or Show Averages for Table Columns.
Admin
— Bri Hillmer on 12/12/2018
@Nick: There is a decimal places setting under Report Options > Answer Option where you can select 0, 1, or 2 decimal places. Here is the documentation with more info:
https://help.surveygizmo.com/help/overall-versus-element-specific#report-options-answer-options
I hope this helps!
Bri Hillmer
Documentation Coordinator
SurveyGizmo Customer Experience Team
— CRE on 12/12/2018
I have single row likert items, I would like the average to be calculated with 2 decimal places... is there a way to do that?.. right now I just see an average with 0 decimal places in my current report.