
- Check it out in an example survey!
- Add a survey with this question to your account!
The Checkbox Grid allows respondents to select multiple answer options (columns) for each row in a table.
When To Use It
Use a Checkbox Grid to group a series of checkbox questions together that share the same answer options.
Survey Taking
On a desktop and most laptops the Checkbox Grid question type looks like so.

When optimized for mobile devices the Checkbox Grid question type displays each row one at a time. It will also have larger targets as mobile respondents will be using their finger to select answers.
You can turn off the one-at-a-time interaction if you wish.

Reporting
Checkbox Grids report as a Grid by default. Each row and column combination will have a count of checks (aka selections) and a row %. The Total Checks for each row will also display in the table by default. If you prefer to have your checkbox stats use responses rather than checks check out the additional available statistics.

Checks
- This is the count of checks (aka selections) for that cell.
- When talking about this statistic in plain language we can say, "17 respondents said they used the Pool during their current visit."
- The Checks displayed in the Total Checks row at the bottom of the grid can be turned on/off using the Column Total Checks option under Layout & Options > Grid Options.
Row Check %
- This is the percentage for the cell with the row total as the denominator. So, for example, the 56.7% that displays in the first cell is calculated by dividing 17 by 30.
- When talking about this statistic in plain language we can say, "56.7% of visits to the pool were during respondents' current visit."
- This statistic can be turned on/off using the Row Check % option under Layout & Options > Grid Options.
Total Checks
- This is the count of checks (aka selections) for the row.
- When talking about this statistic in plain language we can say, "There were 30 total visits to the pool over all visits."
- This statistic can be turned on/off using the Row Total Checks option under Layout & Options > Grid Options.
% of Total Checks
- This statistic, displayed in the Total Checks row at the bottom of the grid , is the percentage for the column with the total checks for the entire question as the denominator. So, for example, the 42.1% that displays in the last row, first column is calculated by dividing 40 by 95.
- When talking about this statistic in plain language we can say, "42.1% of all visits took place during the current visit."
- This statistic can be turned on/off using the Column Total Check % option under Layout & Options > Grid Options.
See additional available statistics
The following additional statistics are available for reporting in Checkbox Grids: Row Total Responses, Row Response %, Row Total Response %, Column Check %, Column Total Responses, and Column Total Response %. In the below example report all available statistics are turned on. Let's cover how each of these is calculated.
Responses
- This displays the count of unduplicated responses for that row. It is effectively the number of respondents who checked any box in that row.
- When talking about this statistic in plain language we can say, "23 respondents visited the pool during at least one visit."
- This statistic can be turned on/off using the Row Total Responses option under Layout & Options > Grid Options.
Row Response %
- This is the percent of unduplicated responses for that cell using the Responses total for the row as the denominator. So, for example, 73.9% is calculated by dividing 17 by 23.
- When talking about this statistic in plain language we can say "73.9% of respondents who said that they visited the pool said they did so during their current visit."
- This statistic can be turned on/off using the Row Response % option under Layout & Options > Grid Options.
Row Total Response %
- This is the statistic that displays in the Response column on the far right. It is the percentage of responses for that row using the total unduplicated responses to the question overall as the denominator. So, for example, the 79.3% that displays in the top cell of the Responses column is calculated by dividing 23 by 29.
- When talking about this statistic in plain language we can say "79.3% of all respondents used the pool during at least one visit."
- This statistic can be turned on/off using the Row Total Response % option under Layout & Options > Grid Options.
Column Check %
- This is the percentage for the cell with the column total as the denominator. So, for example, the 65.4% that displays in the first cell is calculated by dividing 17 by 40.
- When talking about this statistic in plain language we can say, "38.8% of all Never responses were in response to the use of Facebook to look for products and services."
- This statistic can be turned on/off using the Column Percents option under Layout & Options > Grid Options.
Column Total Responses
- This displays the count of unduplicated responses for that column. It is effectively the number of respondents who checked any box in that column.
- When talking about this statistic in plain language we can say, "40 respondents reported visiting at least one facility during their current visit."
- This statistic can be turned on/off using the Column Total Responses option under Layout & Options > Grid Options.
Column Total Response %
- This displays the percent of unduplicated responses for that column using total responses to the question overall as the denominator. So, for example, the 89.7% that displays in the first cell for the Totals row can be calculated by dividing 26 by 29.
- When talking about this statistic in plain language we can say, "89.7% of respondents who reported visiting at least one facility during any visit did so during their current visit."
- This statistic can be turned on/off using the Column Total Response % option under Layout & Options > Grid Options.

Learn how to report on grid rows separately
In Standard Reports the rows of both Radio Button Grid and Checkbox Grid questions can be reported on separately as various chart types. Here are the steps to set this up:
Click the Insert button between any two report elements and select Question Chart from the dropdown menu. In the next dropdown menu look for your grid question. Instead of selecting the overall question title, select the first row of the grid, seen below, and click Add Question. Continue adding each row of the grid question.

This will add the new pie charts or bar charts to the bottom of your report. You can reorder this reporting element if you wish and then click Save. This will re-run the report.
This will display the rows of the table in chart format. Beautiful!

See additional compatible chart types
Within the Standard Report there are various chart types available for visualizing your data. The below grid shows which of the our chart types Checkbox Grid questions are compatible with.
| Chart Type (Aggregate) | Compatible | |
|---|---|---|
| Pie Chart | ||
| Arc Chart | ||
| Donut Chart | ||
| Vertical Bar Chart | (Individual Rows*) | |
| Stacked Vertical Bar Chart |  | (Individual Rows*) |
| Horizontal Bar Chart |  | (Individual Rows*) |
| Stacked Horizontal Bar Chart |  | (Individual Rows*) |
| Spiderweb Chart | ||
| Histogram | ||
| Line Chart | ||
| Spline Chart | ||
| Area Chart | ||
| Area Spline Chart | ||
| Scatter Plot | ||
| Word Cloud | ||
| Collapsed Response List | ||
| Grid | ||
| Diverging Stacked Bar Chart | ||
| NPS Chart | ||
| Contact Cards | ||
| DIY Grid/Cards | ||
| Table |
| Chart Type (Longitudinal) | Compatible | |
|---|---|---|
| Longitudinal Line Chart | (Individual Rows*) | |
| Longitudinal Area Chart | (Individual Rows*) | |
| Longitudinal Spline Chart | (Individual Rows*) | |
| Longitudinal Area Spline Chart | (Individual Rows*) | |
| Longitudinal Vertical Bar Chart | (Individual Rows*) | |
| Longitudinal Stacked Vertical Bar Chart | (Individual Rows*) | |
| Longitudinal Stacked Area Chart | (Individual Rows*) | |
| Longitudinal Stacked Spline Area Chart | (Individual Rows*) |
*See report on grid rows separately to learn how.
See what other report types are compatible
The below grid shows which of the report types Checkbox Grid questions are compatible with. If you plan to do some specific analysis within SurveyGizmo this report compatibility chart should help you choose the right question types.
| Report Type | Compatible |
|---|---|
| Standard | |
| Legacy Summary | |
| TURF | |
| Profile | |
| Crosstab | |
| Comparison | (Individual Rows Only) |
Exporting
The CSV/Excel export will display a column for each row and column combination, displaying the reporting value in the column if the respondent selected that particular value for that particular row.

Best Practice Tip: Grid Questions on Mobile Devices
Grid questions are often used to allow your survey respondents to make comparisons. For example, in the below question, survey respondents are implicitly making a comparison across the various ice cream brands listed in the rows.
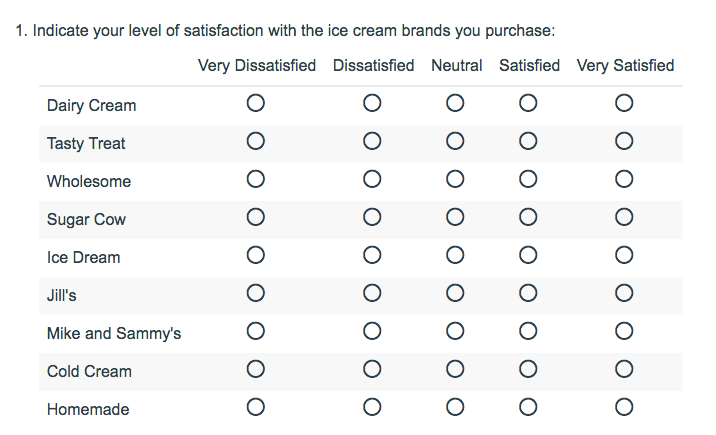
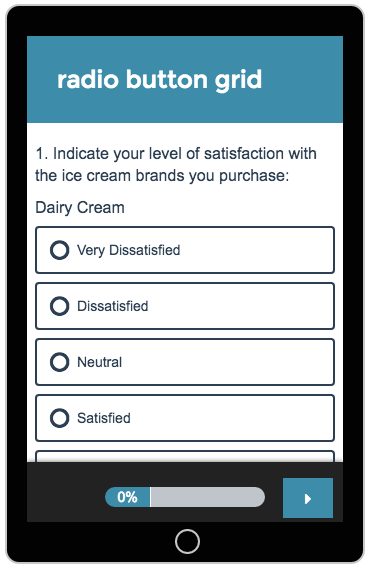
Because this is the most common and best use of grid question types it is important to note how grid question types display on mobile. Grid questions will be displayed one grid row per page. This will reduce horizontal scrolling trouble as well as problems survey respondents typically experience trying to select the correct option.
— CRE on 09/23/2019
No problem, this is a great solution, thank you!
Admin
— Dave Domagalski on 09/23/2019
@Nick: Thank you for your question!
I'm afraid that there is not a way to do this by column without a custom solution. The best alternative may be to swap the columns/rows in your question (2 rows - 8 columns), though this might result in a visually unappealing question.
Another and the potentially better option could be to use two separate ranking questions (each limited to 3 maximum answers).
I'm sorry for the trouble!
David
Technical Writer
SurveyGizmo Learning & Development
— CRE on 09/23/2019
I see there's a way to limit this question type to a minimum number of rows answered, or a minimum number per row... but i wondered if there is a way to do this by column. So for instance, I have 8 rows and 2 columns. I'd like my respondents to choose their top 3 (and only 3) in each column....
Admin
— Dave Domagalski on 06/24/2019
@Cornelius: Thank you for your note!
I'm sorry for the trouble. I'm afraid that there is not an option in the interface to disable a grid row at this time.
As such the workaround that you have mentioned is likely the best option (aside from deleting the row altogether).
I will not your feedback with our Product team as a potential future enhancement.
Thank you for taking the time to share this with us!
David
Technical Writer
SurveyGizmo Customer Experience
— Philip on 06/24/2019
Why is it impossible to disable selected grid rows? That's annoying. The only workaround I've found is to use display logic and show only based on an always false condition.