")
- Check it out in an example survey!
Conjoint is a market research question used to determine how customers value the various features that make up an individual product or service. Use the Conjoint question to determine what combination of features is most influential on customer decision making.
The SurveyGizmo Conjoint question uses choice-based conjoint analysis (CBC) (also known as discrete choice conjoint analysis). CBC is the most common form of conjoint analysis. The respondent is asked to indicate the option or package they are most likely to purchase. The importance of attribute features and levels can be mathematically deduced from the trade-offs made when selecting one (or none) of the available choices.
As an example, say we're researching what attributes are most influential when purchasing a TV. We have the below attributes and attribute levels:
- Brand: Edge, TVC, Yanso
- Screen Size: 36", 40", 48", 56", 60", 75"
- Refresh Rate: 60hz, 120hz, 240hz
- Price: $499, $529, $799, $899, $1099, $1499
- HDMI Ports: 1, 2, 3, or 4 ports
- Wi-Fi: Wi-Fi Enabled, No Wi-Fi
Using the choice-based conjoint question we can show combinations (aka cards) of potential attribute levels to respondents to analyze how they make choices between these products.
Setup
- Click Question on the page where you wish to add your conjoint question.Your conjoint question should be on a page by itself.
- Select Conjoint (Choice Based) from the Question Type dropdown and add your question text. Your question text will depend on the Choice Type as you are going to need to provide instructions for the respondent as to how to respond in the question text or the question instructions field.
- Next, skip down to the Attribute Setup and begin adding your Attributes and their Levels.
- Attributes are the characteristics of a product (e.g. color, price, etc.). An Attribute is made up of various Levels (e.g. silver, black red). In our example, they are Brand, Screen Size, Refresh Rate, Price, HDMI Ports, and Wi-Fi. We recommend displaying no more than 6 attributes in your Conjoint question; any more and respondents will have difficulty weighing options and might resort to simplification strategies, such as ignoring one attribute altogether.
- Levels are the various values of an attribute. So for example, for Price we'll add the following values: $499, $529, $799, $899, $1099, and $1499. The Conjoint question requires, at a minimum, 2 Levels.
If you have an image you wish to display, click the image icon to the far right and select an image from your File Library or upload an image.
Best Practice Tip: Recommended Image Size
For the Conjoint question, we recommend image files of no larger than 200px x 200px.
When uploading images to the file library you have the option to scale your image using pixel width or a percent. There are also various tools online to resize images e.g. http://www.picresize.com/. It is important to note that resizing images may negatively affect the quality of the image.

- Once you have all your Attributes and Levels set up, scroll back up to the Format options. For Choice Type, you have four options.
- Single Choice With None
Single Choice With None provides a radio button for each combination, as well as a none option. Respondents can select a single radio button for each set. Single Choice with None
 - Single Choice
Single Choice provides a radio button for each combination from which respondents can select a single preferred combination. Single Choice
 - Best vs. Worst
Best vs. Worst provides a Best and Worst radio button for each combination. Respondents can select a best and worst combination for each set. Best vs. Worst
 - Continuous Sum
Continuous Sum provides text fields in which respondents can enter a numeric value for each that adds up to a total that you specify. This method is often referred to as chip allocation; the idea being that you can ask respondents to indicate, of the combinations in each set, how many of their next ten purchases would be of each combination.
This doesn't make sense for our TV example, because, how many TVs does one really need? Instead, the Continuous Sum Choice type makes the most sense for something like packaged products, say, for example, breakfast cereals.
If you are using the Continuous Sum Choice Type, it is best to provide instructions for the respondent as to how to respond in the question text or the question instructions field. Continuous Sum
- Single Choice With None
- (Optional) If you are using the Best vs. Worst Choice Type you can customize the Best and Worst labels.

- (Optional) If you are using the Continuous Sum Choice Type, you can customize the Total Maximum, which is the total that respondents' entries must add up to for each set. If you wish to ensure each respondent's total equals the maximum select this option.

- Next, select the Number of Cards per Set to display to each respondent, as well as, the Number of Sets Shown to Each Respondent.Important! Please note that you can only show all possible cards once. This is calculated by multiplying the number of levels for each attribute by each other. For example, if you have 2 attributes, each with 4 levels, then you possible cards are:4 (number of levels for attribute 1) x 4 (number of levels for attribute 2) = 16 (total possible cards)As such, Number of Cards per Set multiplied by Number of Sets Shown to Each Respondent should not exceed the total possible cards. If Number of Cards per Set multiplied by Number of Sets Shown to Each Respondent is greater than the total possible cards, the question will stop displaying cards once it shows all possible cards.


Prohibited Level Pairs
By default, all Attribute Levels have an equal likelihood of displaying together. What this means is that some product combinations that will display in your conjoint question are not realistic. For example, sometimes a product will be shown with all the best features and at the lowest price.
The inclination to prohibit such combination is a common one. You can do so on the Logic tab, however, we discourage the use of prohibited pairs and if you do use them use them sparingly. Learn more.

Survey Taking
On a desktop and most laptops, the Conjoint question type looks like so.

When optimized for mobile devices the Conjoint cards will display vertically to prevent the need for horizontal scrolling on smaller screens. If you do not care for this display, you may want to consider preventing respondents from responding via a mobile device.

Think about the Conjoint question like a set of index cards containing all possible combinations. The index cards are randomized. From this randomized list of cards, a number of cards are selected creating a unique set. For the next set, a number of cards are selected from the same randomized list making sure that the same combination is never displayed a second time to a respondent.
Reporting
There are two elements included in the Standard Report for the Conjoint question.
The Part-Worth Utilities bar chart shows the importance of individual attribute levels based on their part-worth utilities. A utility is a measure of relative desirability or worth. The higher the utility, the more desirable the attribute level. Levels that have high utilities have a large positive impact on influencing respondents to choose products.

Below the Part-Worth Utilities bar chart is an Attribute Stats table for all Attributes and their Levels. Each Level will have a Utility. Each Attribute will have a Relative Importance percentage. All Relative Importance percentages will add up to 100%. Think of Relative Importance as the influence the attribute has on product decision making.
Relative Importance can be different upon reports refreshing even without new data. Conjoint uses a random sample of the data collected and uses a slightly different sample each time the report refreshes.

Best Practice Tip: Interpreting Utilities
Utilities are interval data, meaning the actual values are unimportant, rather the differences between values are what should be interpreted. 20 is not twice as desirable as 10, but 20 is equally “more desirable” to 10 as 30 is to 20.
The overall attribute influence can be quantified by looking at the difference between the smallest attribute level's utility (which is always zero) and the largest attribute level's utility.
So for example, in the above Part-Worth Utilities bar chart, we can conclude that Screen Size has the biggest influence on purchasing decision making for TVs as the difference between the largest utility (75") and the smallest (40") is the largest (49.3 - 0 = 49.3)
The next biggest influencer is Price as the difference between the largest utility and the smallest is the next largest (42.7- 0 = 42.7).
As far as comparing utilities across attributes, you cannot compare the utility values only the differences between them.
Note: Utilities values can be different upon reports refreshing, even without new data. For more information on how these values are calculated, refer to the documentation here on Choice Models.
See additional compatible chart types
Within the Standard Report, there are various chart types available for visualizing your data. The below grid shows which of the chart types Conjoint (Choice Based) questions are compatible with.


See what other report types are compatible
The below grid shows which of the report types Conjoint (Choice Based) questions are compatible with. If you plan to do some specific analysis within SurveyGizmo this report compatibility chart should help you choose the right question types!
| Report Type | Compatible |
|---|---|
| Standard | |
| Legacy Summary | |
| TURF | |
| Profile | |
| Crosstab | |
| Comparison |
Exporting
Raw data exports for the Conjoint question are found under Results > Exports.

The export will include a row per card displayed to each respondent. As you can see below, Response ID 1 takes up rows 2 through 13. The first row is Set 1 Card 1 that was displayed to this respondent. For each card, the levels of each attribute that were displayed to the respondent are included in columns D through G. The final column displays the score this card was assigned. Learn more about how cards are scored.
If you wish to run your own analysis to compute your own part-worth utilities and importances, this is the file you will need to do so.

Creating a Market Simulator
One of the most useful ways to present conjoint data is with a market simulator. Market simulator turns the difficult-to-interpret part-worth utilities into an easy-to-understand, decision-making tool. Using a market simulator you can determine if a new combination of product attributes would do well compared to current products on the market.
Below is the market simulator we created for a Conjoint question about robots. From the below market simulation, we can conclude a number of things.
Let's imagine Gizmobot and Robopal are the existing robot brands. Botpro is a new brand who ran this Conjoint survey to understand what robot attributes will do well in the market. In the below market simulation, we're simulating the 2 Botpro models (C and F) against the market leaders. By toggling the various attribute levels we determined that a Streamlined Botpro robot that does Laundry offered at $550 will have a 66% share of the market!

Steps To Create a Market Simulator
- Export your Conjoint Standard Report Data to Excel. To do so, create or edit your Standard Report. Click the Download Report option in the upper-right corner and select Excel.

- Download our example market simulator below.
Download Example Market Simulator Spreadsheet
- Paste your exported data on the Export from SurveyGizmo tab.
- Copy and paste your Attribute Stats from the exported data to the Utility Lookup tab.
- Now you're ready to start simulating! On the Market Simulator tab, you'll notice the last three columns show as not available. This is because these columns are using the Excel VLOOKUP function and the data on your Utility Lookup tab does not yet correspond. As such, you'll need to adjust the data on the Market Simulator tab to correspond with your data.
Start by editing the column headers to reflect your attributes. If you have more than 4 attributes you'll need to add a column for each.
Now, you're ready to start building out the combinations of attribute levels that you are interested in understanding. We recommend copying and pasting the attribute values from the Utility Lookup tab to the Market Simulator tab as the VLOOKUP requires an exact match to work. You can add rows and delete rows to simulate additional or fewer combinations.
Learn more about the market simulator and the formulas behind it.


FAQ
Is there a limit (minimum or maximum) to the number of attributes or levels I can use in a Conjoint question?
For attributes, you'll want to have at least 2 and we recommend no more than 6 attributes. When there are more than 6 attributes respondents will have difficulty weighing options and might resort to simplification strategies, such as ignoring one attribute altogether. There is a hard limit of 12 attributes in the application.
For levels, you'll want to have at least 2 and no more than 6 attribute levels. There is a hard limit of 17 attribute levels in the application.
Can I prohibit certain attribute-levels from being paired together?
The inclination to prohibit such combination is a common one. You can do so on the Logic tab, however, we discourage the use of prohibited pairs and if you do use them use them sparingly.
Too many prohibitions can lead to inaccurate utility estimation. We suggest informing respondents that they will see combinations in the survey that are not available or that seem too good to be true. Urge respondents to answer as if these products were actually available.
How does Conjoint function in survey taking?
Think about the Conjoint question like a set of index cards containing all possible combinations. The index cards are randomized. From this randomized list of cards, a number of cards are selected creating a unique set. For the next set, a number of cards are selected from the same randomized list making sure that the same combination is never displayed a second time to a respondent.
Will each respondent see each card?
It depends on how many total cards are shown to each respondent. If the number of cards you show is equal to the total number of possible cards, then each respondent will see each card. This can be very fatiguing, however. Instead, as a best practice, you can display a subset of the total possible cards and rely on multiple respondents to provide you with enough data to cover all possible combinations.
Will cards be shown equally?
Only when the total number of cards (sets x cards) shown to each respondent is the same as the total possible cards will the cards be shown equally across respondents. Typically, though, when running a Conjoint question you'll want to rely on data from multiple respondents in order to ensure that all possible cards are shown.
How many responses do I need?
How are cards scored?
In survey taking, as respondents make selections, scores are assigned behind the scenes. The score that is assigned depends on the Choice Type you are using.
Single Choice
When using the Single Choice Choice Type, selected cards are assigned a score of 100 and unselected cards are assigned a score of 0. If you are providing a none option when it is selected all cards receive a score of 0.
Best vs. Worst
When using the Best vs. Worst Choice Type, cards that are selected as Best are assigned a score of 100 and cards that are selected as Worst are assigned a score of 0. Unselected cards are assigned a score of 50.
Continuous Sum
When using the Continuous Sum Choice Type the score for each card is the value entered by respondents
How Do I Translate the Conjoint Question
Under Tools > Text & Translations you can translate your question text and all attributes and their levels. To get started, click Add Translation and choose the language you want to create a translation for from the dropdown menu. Then find your Conjoint question on the General tab and click Edit to begin translating all your attributes and values.

On the Reports tab of Text & Translations, you can also translate all the text that displays in the Standard Report for your Conjoint question.
Use extra care when translating the Insufficient data error. The only portion of the merge code that pulls in the documentation that should be translated is the Learn More text between the quotes.

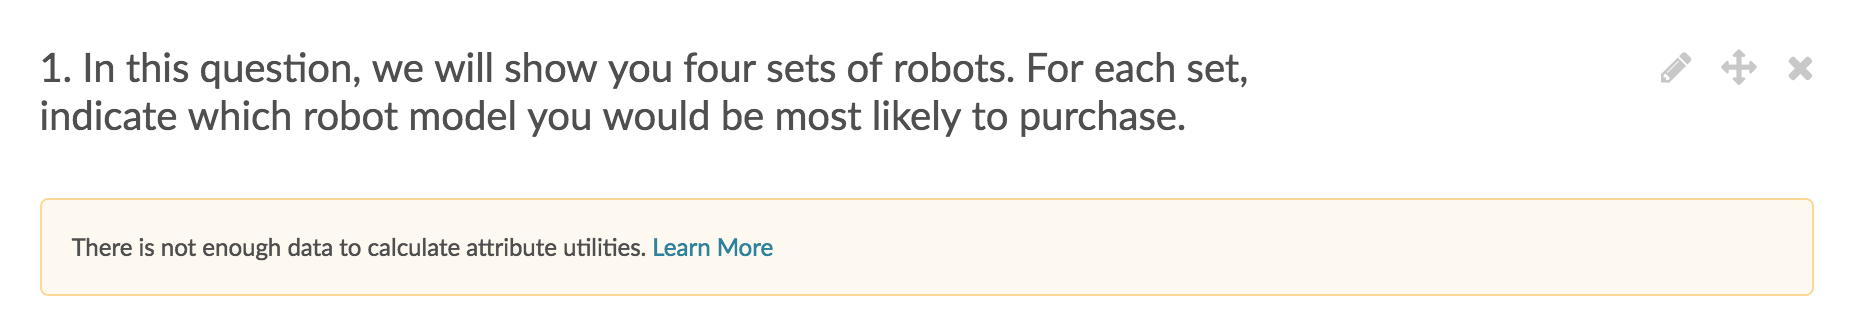
Why Does My Report Say I Don't Have Enough Data?
The below error message in reports for your conjoint question can happen if, in your entire data set, there is a card that was never selected. This is a limitation of the R library we are using to calculate utilities.
Admin
— Dave Domagalski on 07/08/2019
@Oliver: Thank you for your question!
I’m afraid that it is not possible to show standard error and variances for Conjoint questions at this time. I will note this with our Product team as a potential future enhancement.
I’m sorry for the trouble!
David
Technical Writer
SurveyGizmo Customer Experience
— Oliver on 07/05/2019
Hi, is it possible to show standard error and variances for conjoint questions?
Admin
— Bri Hillmer on 03/06/2019
@Jean: That button is a special button that is only present for Conjoint. Long term, we should fix this up so that the back button setting affects this as well. I've made note of this for our product team. In the meantime, this CSS code will hide it for you.
To apply it to your survey go to the Style tab and scroll to the bottom of the survey preview and click the link to access the HTML/CSS Editor and then paste the below code on the Custom CSS tab.
.sg-pseudo-button {
display:none;
}
I apologize for the confusion!
Bri Hillmer
Documentation Coordinator
SurveyGizmo Customer Experience Team
— Jean on 03/06/2019
I have disabled the back button on the general survey but in the conjoint questions, the back button has resurrected itself. How do I disable the back button from the conjoint portion of the survey? Th survey itself has already been designated as forward only
Admin
— Bri Hillmer on 02/08/2019
@Thor: So happy to hear it's helpful!
— Thor on 02/08/2019
It was a great refresher!