This article covers the nitty-gritty details about the Conjoint question.
Analysis Details
We use a research-level statistical library called ChoiceModelR to obtain a part-worth utility for each attribute level for each respondent.
The Data We Send To ChoiceModelR
We send a matrix of data over to R for analysis. Much of the matrix remains the same, however, the data R expects for the dependent variable is different for each choice type.
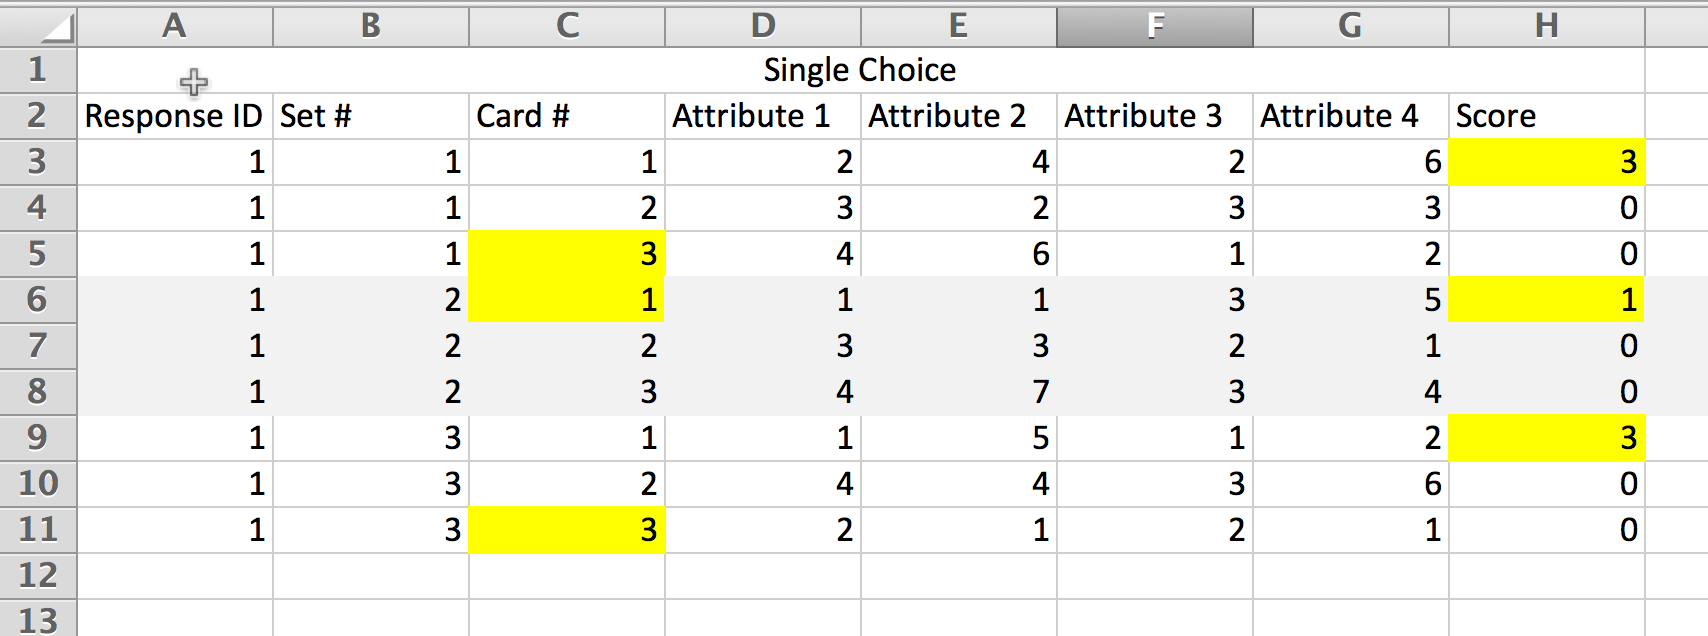
For discrete-choice (Single Choice Choice Type) dependent variables the index of the card that was selected is sent in the first row of data for the set.

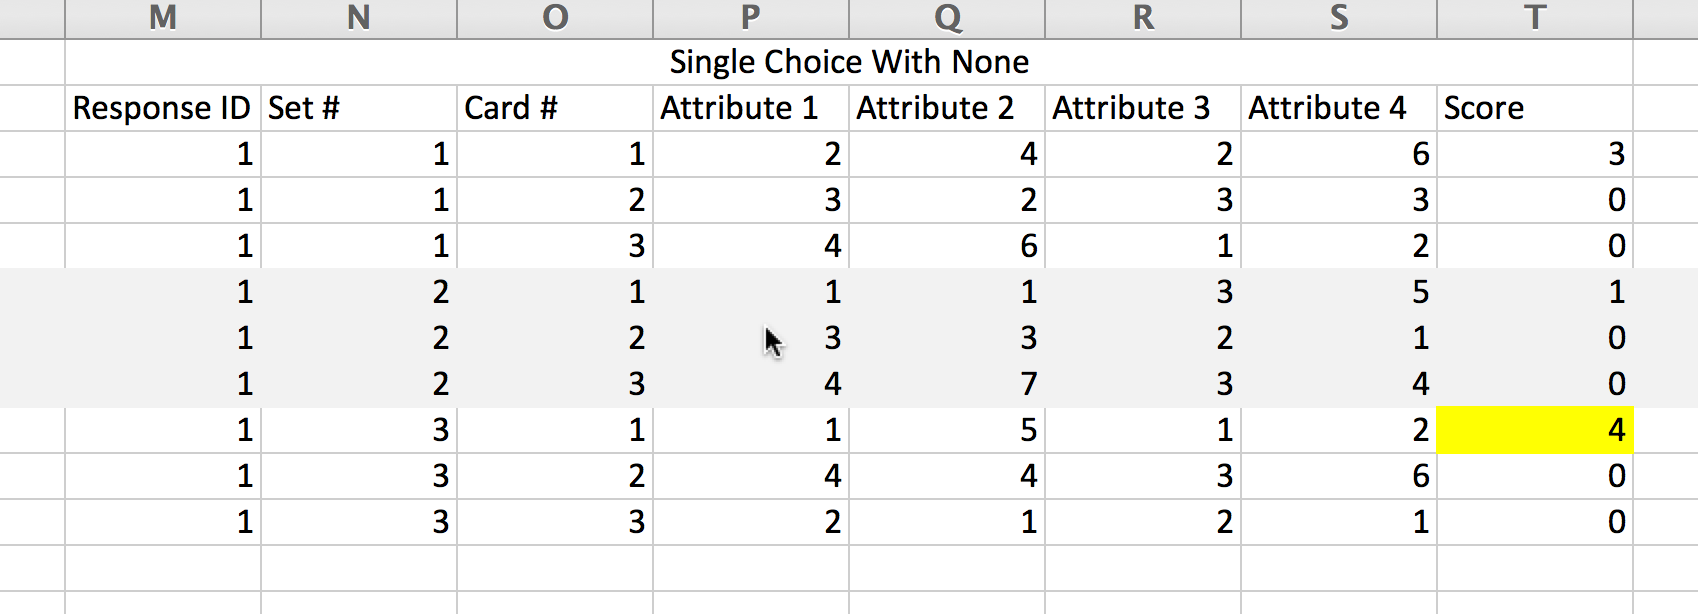
If you provide a none option there is no row to represent this "card," instead, we send the largest card index + 1 to ChoiceModelR which recognizes this as a none selection.

For share dependent variables (Best vs. Worst and Continuous Sum Choice Types) we code the responses a bit differently.
For Best vs. Worst Choice Type cards selected as Worst always receive a score of 0. For unselected cards, a value of 1/# of cards is assigned. The card selected as Best receives a score of 2 x (1/# of cards).
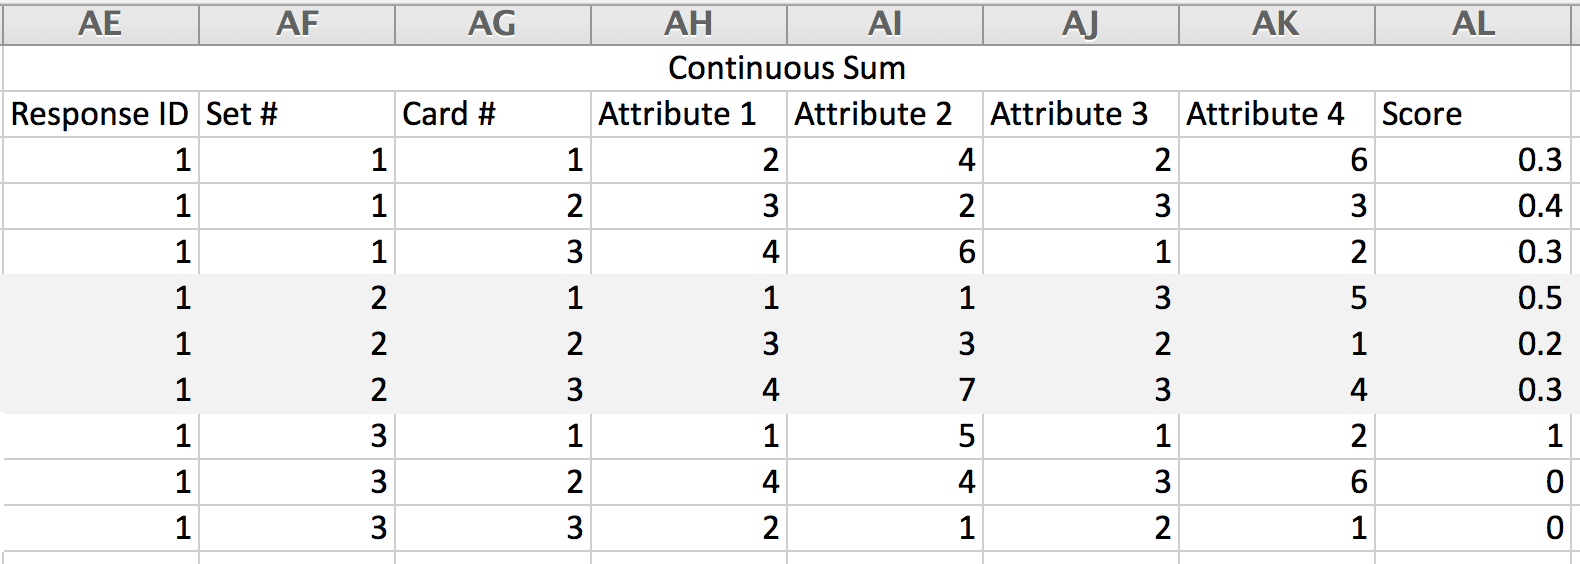
For Continuous Sum Choice Type, the value that is entered by the respondent is converted to a percent (Entered value/Max Total).

What Model Arguments Are Used?
Below are the required arguments for the model and the values we use. If you wish to change these you can do so by running your own analysis in ChoiceModelR.
- R - This is the total number of iterations of the Markov Chain Monte Carlo to be performed. We set this to 4000.
- Use - The number of iterations to be used in parameter estimation. We set this to 2000.
- Keep - The thinning parameter that defines the number of random draws to save. We set this to 5.
- wgt - The choice-set weight parameter for share dependent variables (Best vs. Worst and Continuous Sum Choice Type); possible values are 1 to 10. We set this to 1.
- xcoding - Specifies the way each attribute is coded, continuous or categorical. We code all attributes as categorical,
How are Part-Worth Utilities and Relative Importance calculated?
ChoiceModelR outputs utilities that sum to zero so we shift these by a constant (the largest utility for each attribute) such that all attributes have a level that has a utility of zero. The Part-Worth Utilities displayed in the Standard Report are an average of the respondent-level Part-Worth Utilities.
Next, we compute a Relative Importance percentage for each attribute for each respondent. We do this by calculating how much difference each attribute could make in the total utility of a product for the given respondent. This difference is the range of each attribute's utility values. Because the lowest utility is always zero, we can simply sum the largest utility for each attribute and figure the percentage for each; this is the Relative Importance percentage. The Relative Importance displayed in the Standard Report is an average of respondent-level Relative Importances.
Market Simulator Calculations
- Calculate the total utility for a given product by adding up the part-worth utilities for the specific levels. In the example market simulator, this is done using a VLOOKUP on the utility table and then adding each one.
- Apply a logit rule to that total utility to calculate choice shares of utility. To do so, use Excel to compute e (Euler's number) to the power of the utility of the product. “=exp(U)” where U is the total utility of that product.
- Calculate Market Share for each product. To do so divide the choice share (from the last step) by the total choice shares for all products in the comparison. The output is a percent.
- You can then play around with level combinations to see what would maximize your market share when you introduce a new product.
- Add a pie chart to visualize the market shares!
Why Does My Report Say I Don't Have Enough Data?
The below error message in reports for your conjoint question will happen if, in your entire data set, there is a card that was never selected. This means if there a card that was never selected by any respondent This is a limitation of the R library we are using to calculate utilities.
