A Results Chart allows your respondents to see a chart of the summary for a question in your survey. It will act like one of our Poll projects without being restricted to just one question. You can set up multiple result chart actions to display the results from more than one question in your survey.
Use a Result Chart to show your respondents how other people answered your survey. For example, in quizzes in addition to displaying a quiz score you can use results charts to show your students how other people answered the questions.
Available Chart Types and Compatible Questions
Results Charts have three different chart types available:
- Pie Chart
- Bar Chart (vertical)
- Bar Chart (horizontal)
Pie Chart

Compatible Questions
Vertical Bar Chart

Compatible Questions
- Radio Buttons
- Checkboxes
- Dropdown Menu
- Rating (Likert Scale)
- Image Choice (single)
- Image Choice (multiple)
Horizontal Bar Chart

Compatible Questions
- Radio Buttons
- Checkboxes
- Dropdown Menu
- Rating (Likert Scale)
- Image Choice (single)
- Image Choice (multiple)
Add a Results Chart
Results Charts can be displayed on any page after the first page. They must be added to the page subsequent to the question you would like to display in the Results Chart.
- Click Add New Action.
- Select Results Chart.
- Enter a Name (this can be a public or internal title - you can toggle it on/off with the next setting).
- If you would like to show the name of your result chart action when the results are displayed to respondents, select the Show Name option.

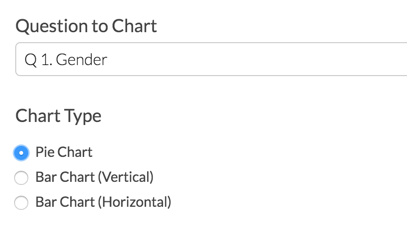
- Select the Question to Chart, then the Chart Type.
- (Optional) Display Options - If a question has more than 7 answer options, you can choose to check this box in order to group additional answer options into an other category.
- (Optional) Custom Colors- If you have specific colors in mind you can specify them using comma separated hexadecimal colors.

- Make sure to Save Action when you are finished customizing your action.


Logic in Results Chart Actions
On the Logic tab use the logic builder to conditionally display the Results Chart.
Test Your Results Chart
In order to see the results chart in action you will need to generate some test responses and then record a live response using the share link on the Share tab. The Results Chart will NOT appear when accessing the survey via the Preview option.
Once you've confirmed everything is working if you have generated Test data in your survey, you will want to make sure you delete those responses before going live the survey as those responses will count in the result charts.
Admin
— Dave Domagalski on 08/12/2019
@Marcus: Thank you for your question!
The Results Chart Action allows for showing results on a per-question-basis. As such, it doesn't sound like a great solution for what you are looking to display (as you would need to add a separate action for each question).
It sounds like you are looking to add a single chart that consolidates responses across multiple questions, which I'm afraid is not possible as an out-of-the-box feature.
One potential alternative would be to use SurveyGizmo's Quiz Score Action to provide feedback based on 'scoring' that you have assigned to each question/answer:
https://help.surveygizmo.com/help/create-a-quiz
I hope this helps!
David
Technical Writer
SurveyGizmo Learning & Development
— Marcus on 08/12/2019
Is there a way that I can create a results chart just to visually show respondents how they answered each question? For example- I'm using imagine (select one) questions where they can choose between red, yellow, and green answers. At the end of the survey, I would love to show them a results chart indicating they picked 20% red, 40% yellow and 40% green as an example.
Admin
— Dave Domagalski on 05/24/2019
@ITS-ADI: Thank you for your question!
While changing the style of the Results Chart is limited in terms of out-of-the-box options, it is possible to make changes via JavaScript.
I'm afraid that at this time, we do not have any readily available sample scripts for this.
A possible alternative could be to embed a Standard Report in your survey. The Standard Report provides an iFrame embed code as one of the sharing methods:
https://help.surveygizmo.com/help/share-email-and-schedule-a-report#embed-a-report
This code could be embedded in your survey via the process described here:
https://help.surveygizmo.com/help/embed-document#embed-in-an-iframe
I'm sorry for the trouble and hope this helps!
David
Technical Writer
SurveyGizmo Customer Experience
— ITS-ADI on 05/23/2019
Is it possible to change anything about the result chart via styling? I have a multiple choice question with long text choices. The resulting chart is unreadable. Having the option to use the Reporting Value for the question would be awesome, but in lieu of that, being able to increase the size of the chart element would be great. I'm playing around with custom CSS and JavaScript but so far not having any luck (although I can change the height manually in my browser and it works).
Admin
— Dave Domagalski on 04/05/2019
@Virag.reti: Thank you for your question!
When using Email Campaigns, Results Charts will work just as they would with the default/primary link.
If you are not seeing the Results Charts populating with data right away, it could be that responses have not quite processed to be available for the charts.
If you continue to not see data populate within the Results Chart, please don’t hesitate to reach out to our Support team and we can take a closer look!
https://help.surveygizmo.com/help/surveygizmo-support-hours
David
Technical Writer
SurveyGizmo Customer Experience
— Daniel.horvath on 04/05/2019
How does result charts work with email campaigns?
If I am using unique survey links for each contact, is it possible to show a result chart at the end of the survey?
In my test I have seen the result chart working with the default survey link, but not with the email campaign unique links. Is there a solution for this?
Admin
— Dave Domagalski on 10/24/2018
@Kayce: That is correct. The Checkbox Grid is not compatible with the Results Chart Action.
As an alternative, I might suggest providing a link to a Standard Report within your survey:
https://help.surveygizmo.com/help/share-email-and-schedule-a-report#share-your-standard-report
The Standard Report could be customized to display only the Checkbox Grid data.
I hope this helps!
David
Documentation Specialist
SurveyGizmo Customer Experience
— Kayce on 10/24/2018
So we are unable to have the results chart show the results of a checkbox grid?
Admin
— Bri Hillmer on 11/23/2016
@Brianna: My pleasure! Yeah I usually load up a number of responses before sharing the survey so at least there is something to show!
Bri
Documentation Coordinator
SurveyGizmo Customer Experience Team
— Brianna on 11/23/2016
@Bri Thank you! I just watched the video where test responses were mentioned. I think we'll try that until we have some real responses.
Admin
— Bri Hillmer on 11/23/2016
@Brianna: You are correct that it takes a little while for the data to display. Responses need to be processed before the data is available for display throughout SurveyGizmo. This can take upwards of 5 minutes.
I hope this helps!
Bri
Documentation Coordinator
SurveyGizmo Customer Experience Team
— Brianna on 11/23/2016
Is anyone having issues with the results chart not updating very quickly? It seems to take 5-10 minutes for the newest results to populate on the chart. We want to say something like "see how your answers compare to others" but we're concerned that we'll be showing inaccurate results.
Admin
— Bri Hillmer on 09/13/2016
@Hptsurvey: Thanks for this feedback. I now realize that when I previously responded to @Gdevincenti I didn't realize he was looking for spider charts in the results chart. We're currently adding more chart types to the Standard Report but have nothing slated for the Results Chart currently. I'll pass along this feedback to our development team as a possible future improvement for results charts!
Bri
Documentation Coordinator/Survey Sorceress
SurveyGizmo Customer Experience Team
— Hptsurvey on 09/13/2016
@Bri, agree with @Gdevincenti, spider charts would be amazing!
Admin
— Bri Hillmer on 09/06/2016
@Lanawertz: Hidden values and quiz scores are not available for reporting in the results chart action. What you are looking to achieve would require custom scripting.
If you have someone on your team that is fluent with custom scripting or JavaScript they might be able to build this for you. Here is our scripting documentation if you want to try your hand at this:
http://script.surveygizmo.com/help
Alternatively, our programming services team can tackle a project like this. Get more information here:
https://www.surveygizmo.com/programming-services/
Bri
Documentation Coordinator/Survey Sorceress
SurveyGizmo Customer Experience Team
— Lanawertz on 09/03/2016
Bri - I have a personality style survey with 15 sections, 10 questions each, i.e. 150 questions. I don't want to share the responses to the questions. I want to create a report of the tallies score per section into an individual response chart. I have set up hidden values to show them their tally scores along with a message within the survey and I have also set up an auto response email with the same tally scores and messages. Is it possible to develop a chart that would let them see all 15 sections in a bar chart for example? Thanks for your help.
Admin
— Bri Hillmer on 07/13/2016
@Viv: Indeed! You can move the Results Chart to the Thank You page so that they don't see the results until they complete the survey. Here is a tutorial that covers how to move questions and other elements about in your survey:
https://help.surveygizmo.com/help/article/link/reorder-questions-and-pages
I hope this helps!
Bri
Documentation Coordinator/Survey Sorceress
SurveyGizmo Customer Support
— Viv on 07/13/2016
Hi - I've tried this out and it looks as if respondents will see how others have answered before they answer themselves! Is that correct? Can you choose to display total results after the respondent has answered?
thanks - Viv
Admin
— Bri Hillmer on 07/11/2016
@Meganhkelley: The results chart will not show in preview, which is what is used on the Style tab. You'll need to record a live response in order to get it to display. Also you'll need a little data in order for it to show up until there is a little data to display. If you record 5-10 live responses you should see it display in a live response. From there you can use custom CSS to style the chart.
I hope this helps!
Bri
Documentation Coordinator/Survey Sorceress
SurveyGizmo Customer Support
— Meganhkelley on 07/10/2016
Is there a way to use custom HTML/CSS for the results chart itself? The chart does not appear on the Thank You page when I'm styling my survey — does this mean I can't use custom code to control its appearance?