This report type is only available in accounts and surveys created before March 2016.
Support for Legacy Summary Reports will be removed on September 1st, 2019. After this date, Legacy Summary Reports will no longer be supported by our Support or Development teams. Learn more.
The Legacy Summary Report is a great tool to summarize, analyze and share your results. You can customize, filter and share your Legacy Summary Reports with your colleagues, customers and other project stakeholders.
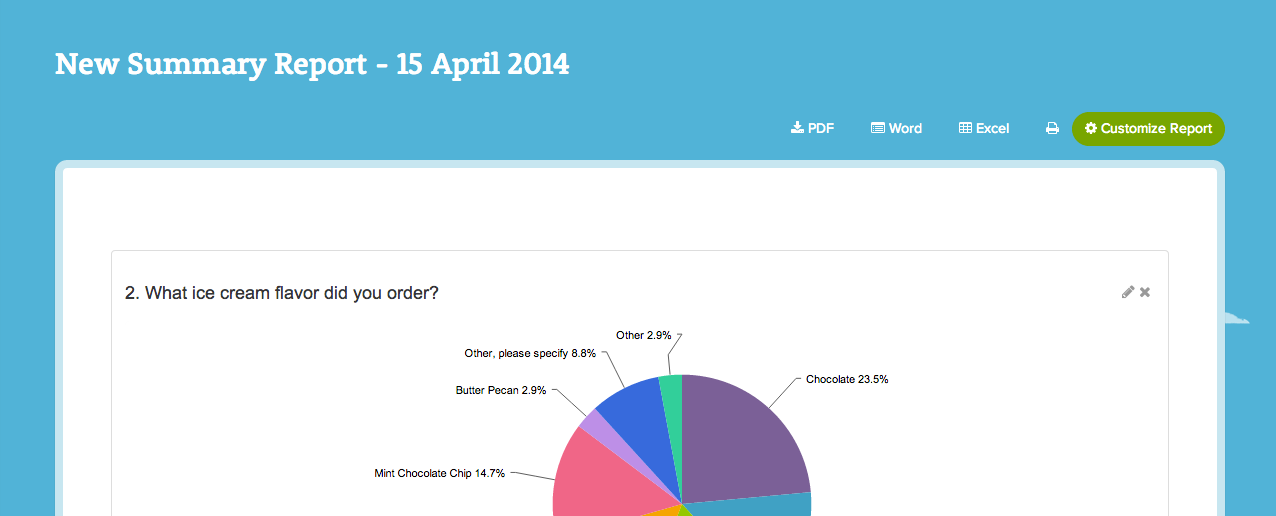
To get started click the New Report button on the Report tab of your project. In the popup customize the inclusion of various open text fields and the display of custom tables if you are using them and click Create Report. This will take you to a summary view of your data for all questions in your survey.
Upon creation Legacy Summary Reports have a number of default settings that can be customized in order to get you the data you need. Below we'll cover some common Legacy Summary Report Customizations.
To make changes to this initial view, click Customize Report in the top right-hand corner.
Include Open-Text Responses
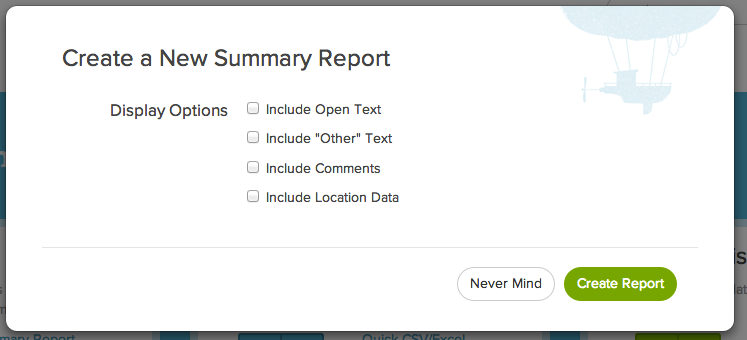
By default, responses from open-text questions are not included in reports. However, including open-text data is easy! Simply go to Create New Report and select the open-text data you wish to include from the display options.
Which open text option is which?
Include Open Text - This will include data from all standalone open text questions from your survey. This includes textbox questions including number, email, percent validated fields, as well as, textbox fields in Custom Groups and Contact Groups.
Include "Other" Text - This will include data from all "other" answer options as a table below your primary results.
Include Comments - This will include data from all Comments fields added to your questions.
Adding and Deleting Questions
On the General tab the list you see here is the questions that will be included and reported on when you run the report. You can customize which questions to be included here.

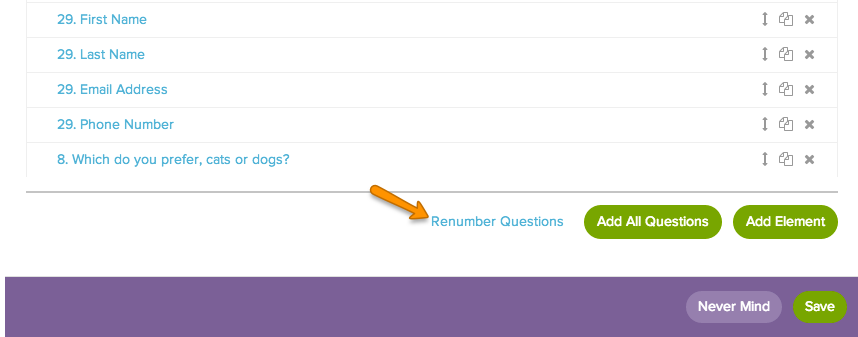
Scroll to the bottom of the list of questions and click either Add All Questions to do just this or, to add a single question, click Add Element.
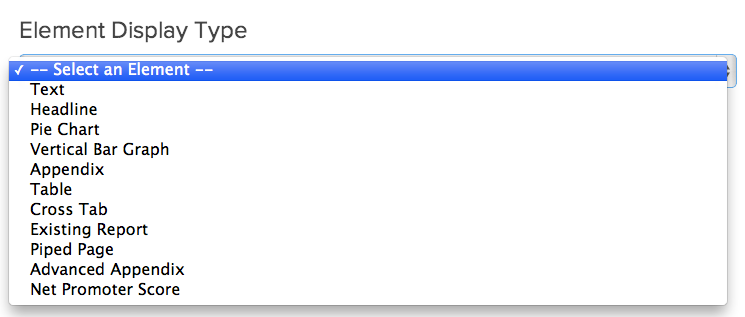
Start by selecting the Element Display Type. You will want to keep in mind question type compatibility when selecting the reporting element. To learn more visit our tutorial on Legacy Summary Report Chart Types.
Next select the Source Question/Data that you wish to report on and customize the Headline, Number and Text included with the question in the report below and click Save. The new element will be added to the bottom of the report. If you wish, you can reorder. Or click the Renumber Questions link below to quickly renumber all of the reporting elements in your report.
To delete elements you can do so one by one by clicking the X icon on the far right. To delete questions in bulk check the Report Element box in the top left of the list of questions and de-select the questions you wish to keep. Scroll to the bottom of your list of questions to the Select a bulk action dropdown menu and select Remove element and click Apply. You may need to click the link to the right to Renumber Questions depending on which questions you removed.
Change Chart Type
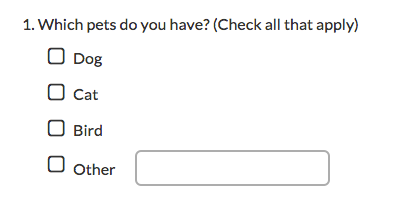
Within Legacy Summary Reports, each question type has a default chart type. For example, radio button questions will report as a pie chart by default and checkbox questions report as a bar chart. To learn more about the default chart types, visit our tutorial on Legacy Summary Report Chart Types.
If you would like to change the chart type of a given question, simply click the pencil icon to edit and under Element Display Type select your desired chart type. It is important to note that some questions and chart types are not compatible. For example, the answers to a checkbox question add up to more than 100%, hence the pie chart will not display your data correctly. Check out our Legacy Summary Report Chart Types tutorial for question-chart compatibility.

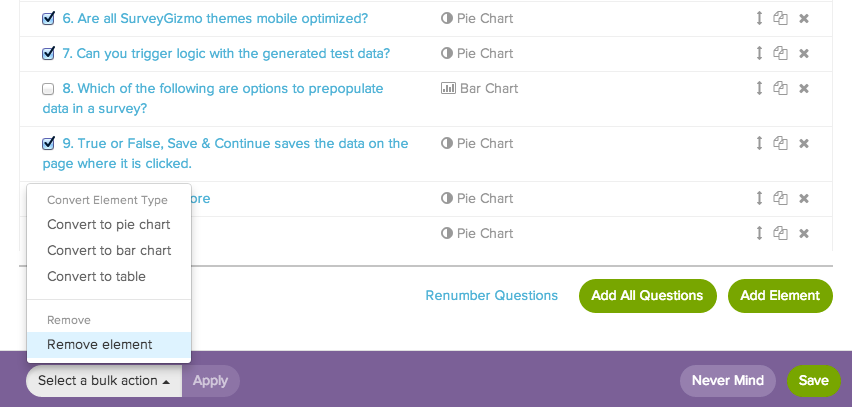
You can also change the report element chart type in bulk by clicking the Report Element checkbox above the list of questions. This will select all the questions, uncheck the ones you don't want to convert then click the Select a Bulk Action menu. You can then choose from Convert to pie chart, convert to bar chart, convert to table or Remove Element.

You can also customize the color of your Legacy Summary Report charts on the Charts tab, using HEX color codes. If you put your own colors in, the charts will repeat only your custom colors, so make sure they work together!
Remove "All Others"
By default, Radio Button and Checkbox questions with 11+ answer options will group answer options 8+ into an "All Others" category in Legacy Summary Reports.

You can easily change this setting for all Pie and Bar Charts under Charts > Show all options in graph.
There are also a couple of customization options available to apply on a question-by-question basis. First, you can turn this off per question by editing that corresponding element in your report and selecting Show all options in graph.
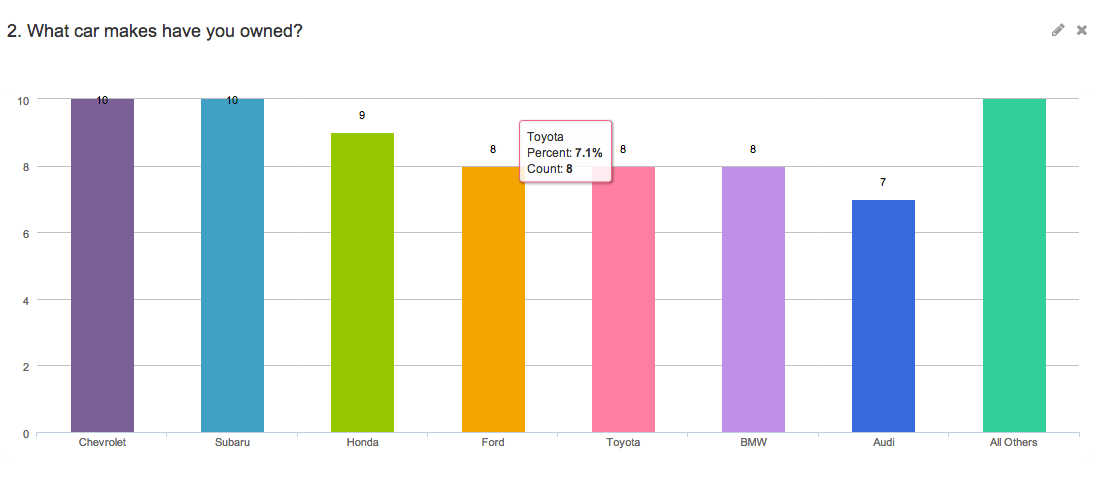
If you don't mind the "All Others" bar or slice but prefer it to represent the answer options with the smallest number of responses you could select the option to Order By: Number of responses. This will keep the "All Others" bar or slice but ensure that it represents the answer options with the lowest number of responses as pictured below:
Report on Table Rows Separately
The rows of both radio button and checkbox grid questions can be reported on separately as either a pie or a bar chart. Here are the steps to set this up:
Click Customize Report. On the General tab scroll to the bottom of your questions and click Add Element. For a radio button grid select the Pie Chart in the Element Display Type dropdown. For checkbox grids select the Vertical Bar Graph.
In the Source Question/Data field select the first row of the table in the dropdown, seen here:

Customize the Headline (populated with the row header by default), Number and Text fields if you wish and click Save.
This will add the new pie or bar chart to the bottom of your question. You can reorder this reporting element if you wish and then click Save. This will re-run the report.
This will display the rows of the table in chart format. Beautiful!

Remove NA Answer Options
Well-designed survey questions often allow customers an opt-out option like "not applicable" to maintain the question's validity. If you are using this option, you'll likely also want to remove this option from your reports.
To remove NA options from your report click Customize Report and go to the Options tab and check the option to Exclude NA options. For all questions with answer options set to NA this will remove them from the chart, table and total response count!
Haven't set up any NA options yet? You can do so by following the steps below!
- Edit the question with the NA option.
- Edit the NA option (it can be called whatever you wish NA, N/A, Not Applicable, Does not apply, etc.) by clicking the pencil icon.
- Select Not applicable in the Special Settings dropdown menu.
- Click Done and Save.
Include Partial Responses in Your Report
The default Legacy Summary Report will include only Complete and Test responses. If you would like to customize the responses included in your report by status click Customize Report and go to the Filter tab.

You can also filter your report by the following:
- Date
- Response IDs
- IP Address
- Campaign
- Filter rules using questions in the survey, email campaign data, or system data.
Customize or Exclude Statistics
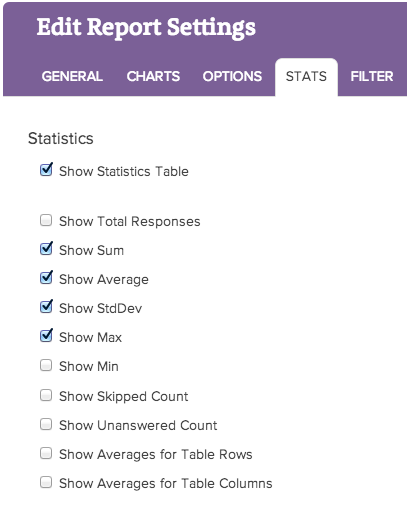
The default report will include a statistics table with the Sum, Average, StdDev and Max statistics. On the Stats tab you can choose which statistics to include in your report or uncheck the Show Statistics Table to exclude statistics altogether.
Please note you must have numeric Reporting Values to utilize Legacy Summary Report statistics.
- Total Responses - Total responses to the question.
- Min - The minimum value selected across all responses. Available for questions with numeric reporting values.
- Max - The maximum value selected across all responses. Available for questions with numeric reporting values.
- Sum - The sum is computed by multiplying the number of responses for each option by its numeric reporting value and summing. Available for questions with numeric reporting values.
- Avg - Average is the Sum divided by the Total Responses. Available for single select questions with numeric reporting values.
- StdDev - Standard deviation is a measure of variation. Available for questions with numeric reporting values.
- Unanswered Count - Total responses that did not answer the question regardless of logic that may have skipped them past the question.
- Skipped Count - Total responses who saw the question but elected to move past without answering (question must be unrequired).
- Checkbox Average For checkbox questions with numeric reporting values, you can choose between the option to calculate the average reported in two different ways.
- Calculate based on the number of responses submitted - With a checkbox question, it's possible to select more than one answer option so this average shows the total of the reporting values selected divided by the number of responses.
- Calculate based on the number of answer options selected - This average takes the total number of answer options selected divided by the number of responses.
If you do not have numeric reporting values, the calculate based on the number of responses won't be particularly helpful and the calculate based on the number of answer options selected will simply show you the average number of options selected by the respondents.
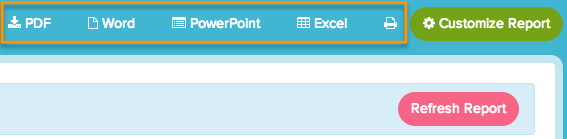
Download a Hard Copy of Your Report: PDF, PowerPoint, Word or Excel
Once you are finished customizing your report you can export of the entire report either as a PDF, Word, PowerPoint or Excel document. Or click the printer icon to print the report.
Admin
— Bri Hillmer on 07/06/2016
@Mitch: It sounds like you are referring to table averages for grid questions? I tested this out in the Legacy Summary Report and confirmed that these don't export to Excel like you describe but I have some good news; they export to Excel from the Standard Report. Not sure where to add these in the Standard Report? This is documented in the reporting section of the Radio Button Grid Tutorial:
https://help.surveygizmo.com/help/article/link/radio-buttons-grid#reporting
I hope this helps!
Bri
Documentation Coordinator/Survey Sorceress
SurveyGizmo Customer Support
— Mitch on 07/06/2016
The response AVERAGE column shows in my Legacy report within Survey Gizmo but doesn't show when I download the report to and Excel. Any ideas?
Admin
— Bri Hillmer on 04/14/2016
@Corinne: For the Legacy Summary Report we do actually have an option that allows you to insert page breaks manually to prevent what you describe from happening. Here is a tutorial with more info:
http://help.surveygizmo.com/help/article/link/insert-page-breaks-and-page-numbers
Bri
Documentation Coordinator/Survey Sorceress
SurveyGizmo Customer Support
— Corinne on 04/13/2016
Looking how to print a report that doesn't put the question on one page and the answers on the next. Didn't find it.
Admin
— Bri Hillmer on 03/07/2016
@Karen: For Summary Reports you can just take advantage of the filter tab to set up the rules for the responses you wish to review. Here is our tutorial on filtering reports:
http://help.surveygizmo.com/help/article/link/filter-report-data
I did note that it sounds like you might be referring to individual response downloads. In this case you would just need to click through the responses one by one and click the Download button in the lower-left corner of each response if you wish to download it. Here is our tutorial on responses for your reference:
http://help.surveygizmo.com/help/article/link/viewing-responses#downloading-and-printing-responses
I hope this helps!
Bri
Documentation Coordinator/Survey Sorceress
SurveyGizmo Customer Support
— Karen on 03/04/2016
is there a way to download ONLY specific responses....for example, I have 15 people who responded to a the survey, but if they answered a certain way on question #3, I want to download only those who responded a specific way.
Admin
— Bri Hillmer on 02/04/2016
@Trish: This statistic is included in the Results Overview.
http://help.surveygizmo.com/help/article/link/results-overview
If you wish to include this in a Summary Report you'll need to use a Text element covered in this tutorial:
http://help.surveygizmo.com/help/article/link/reporting-element-display-options#headline-text
I hope this helps!
Bri
Documentation Coordinator/Survey Sorceress
SurveyGizmo Customer Support
— Trish on 02/04/2016
I'm looking for a way for my report to show how many survery's were completed vs how many were sent
Admin
— Bri Hillmer on 01/13/2016
@Steve: We do not have a built-in way to add text from your survey into a report. You can manually add it using the Headline and Text Summary Report Elements. Here is a tutorial with more info:
http://help.surveygizmo.com/help/article/link/reporting-element-display-options#headline-text
Bri
Documentation Coordinator/Survey Sorceress
SurveyGizmo Customer Support
— Peter on 01/13/2016
Looking for information on running a report that includes text elements and intro copy from the survey within the report. Any help is appreciated thanks, steve
Admin
— Bri Hillmer on 01/06/2016
@Onderzoeker: We do not have a built-in way to do this kind of recoding of the answer option values however you can leverage reporting values to accomplish this.
Here is our tutorial on reporting values:
http://help.surveygizmo.com/help/article/link/define-your-own-reporting-values
Basically what you would need to do is define the reporting values for each option with the ranges that you wish to use in reporting. It would look something like so:
Option Reporting Value
18 18-24
19 18-24
20 18-24
21 18-24
22 18-24
23 18-24
24 18-24
25 25-29
etc.
Then, when you are ready to report on your results, the Summary Report will default to using the option title instead of the reporting value. To customize this click Customize Report and on the General tab click the age question. Scroll to the Answer Titles option and uncheck to Show answer title when displaying report. This will make it so your report uses the reporting value you defined.
Here is a tutorial that covers a the same workaround:
http://help.surveygizmo.com/help/article/link/top-box-or-top-2-box-reporting
I hope this helps!
Bri
Documentation Coordinator/Survey Sorceress
SurveyGizmo Customer Support
— Onderzoeker on 01/06/2016
Hello, I used the dropdown menu in option, in my survey, for the question: how old are you? With the answer options 18 - 99. In the report I want to use ageclasses 18-24, 25-29, 30-34, 35-39, etc. What is the best way to achieve that?
Admin
— Bri Hillmer on 10/29/2015
@Threresa: If you are looking to just see individual data you'll probably just want to look at each Individual Response. Here is our documentation on viewing responses:
http://help.surveygizmo.com/help/article/link/viewing-responses
If you are looking to compare one response to all others you might want to check out our Profile Report:
http://help.surveygizmo.com/help/article/link/profile-report
I hope this helps!
Bri
Documentation Coordinator/Survey Sorceress
SurveyGizmo Customer Support
— Theresa on 10/28/2015
Hello, I've updated a survey that a predecessor created last year to do performance reviews within our team. I've used Logic to differentiate the different employees in different roles, and I'm confused how I'll be able to generate reports for each employee now. Help?? This article didn't really help me understand how I can isolate results like this in the reporting.
Admin
— Bri Hillmer on 10/28/2015
@Brian: It is a touch confusing. There is a dropdown menu at the bottom of your list of questions on the General tab called "Select bulk action". You'll use this to remove the questions that you don't want to report on. So, instead of ticking the questions you wish to include check off the ones you want to remove and then scroll to the bottom of the general tab and select Remove elements from the bulk action dropdown then click apply.
I hope this helps!
Bri
Documentation Coordinator/Survey Sorceress
SurveyGizmo Customer Support
— Brian on 10/27/2015
G'day SG. I want to run a summary report that includes results for some - but not all - of the questions in my survey. I thought it would be as easy as selecting only the question elements I want and leaving the rest unselected. But when I run my report I still get results for every question. Am I missing something in your documentation (Create and Customize a Summary Report)?
Admin
— Bri Hillmer on 09/29/2015
@Stephanie: I took a peek at your account and refreshed one of your excel exports and was able to download all the data. They may have been created before the test data was fully processed. Take a look again and let me know if you run into further trouble!
Bri
Documentation Coordinator/Survey Sorceress
SurveyGizmo Customer Support
— Stephanie on 09/29/2015
Hello I created a survey and tested it. I wanted to check how to create reports in Excel with the Test but the report appeared blank, I wonder if i need to do something else in order to get reports or if the report showed blank because it was a test. Thanks.
Admin
— Bri Hillmer on 09/28/2015
@Sheila: I'm glad the report themes help! I'm sorry to say that the option to change the chart colors will need to be done within the report itself. I'll be sure to make note of this for discussion regarding future possible improvements with the development team!
Bri
Documentation Coordinator/Survey Sorceress
SurveyGizmo Customer Support
— Sheila on 09/28/2015
Bri,
Thanks that does help, but I didn't see an option in the Report Theme to set the colors for the charts? Did I miss it or is that somewhere else? We really love that we can use custom colors for charts in the reports, but I don't expect all users to know the exact code for those colors, so I'd like our default chart colors to be our custom ones. Is that possible?