This report type is only available in accounts and surveys created before March 2016. We have a pending plan to deprecate Legacy Summary Reports. Check out the New and Improved Standard Report! If there are features/functionality missing from the Standard Report check out our Known Issues Category in Community to vote and subscribe to updates.
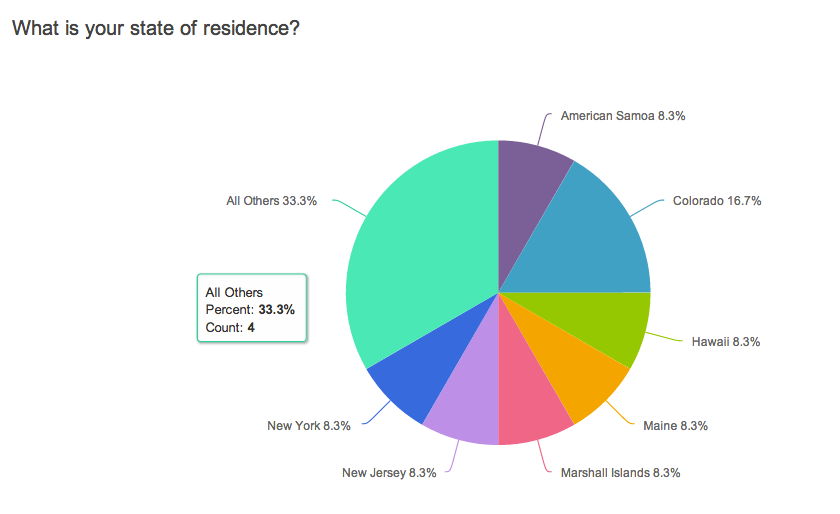
Pie Chart
Use Pie Charts to report on single-select questions.
Default Questions:
- Radio Buttons
- Dropdown Menu
- Image Select (Single)
- Rating (Likert Scale)
Other Compatible Questions:
- Subquestions or rows from a Radio Button Grid
- Dropdown Menu List subquestions
- Textbox questions or Textbox List subquestions with autocomplete values
Options available for Pie Charts:
- Headline - This defaults to the question title. You can modify this in your Summary Report.
- Number - Your report elements are numbered consecutively by default if you indicated you wanted question numbers when you created your report. You can customize the numbering for each report element using this option.
- Text - Use the text field of each report element to add details, description, interpretation, etc.
- Answer Titles - This will display the answer option displayed to the survey taker in your report. Toggle this setting off if you would like to display reporting values instead.
- Table Title and Chart Title - Remove numbering and title from the table and/or chart.
- Options in graph - This will keep the system from combining answer options with smaller percentages together. All options will be displayed in the graph.
- "Other" open-ended answers - Show a table of "other" open-text answers under the main report element.
- Hide response counts - This will hide the response count for this element.
- Order By - Select how you would like the answer options to be ordered; either by Original answer order, Number of responses, or Alphabetically by answer title.
Available Statistics:
- Total Responses
- Skipped count
If reporting values are numeric
- Sum
- Average
- StdDev
- Max
- Min
What does it look like in my Summary Report?
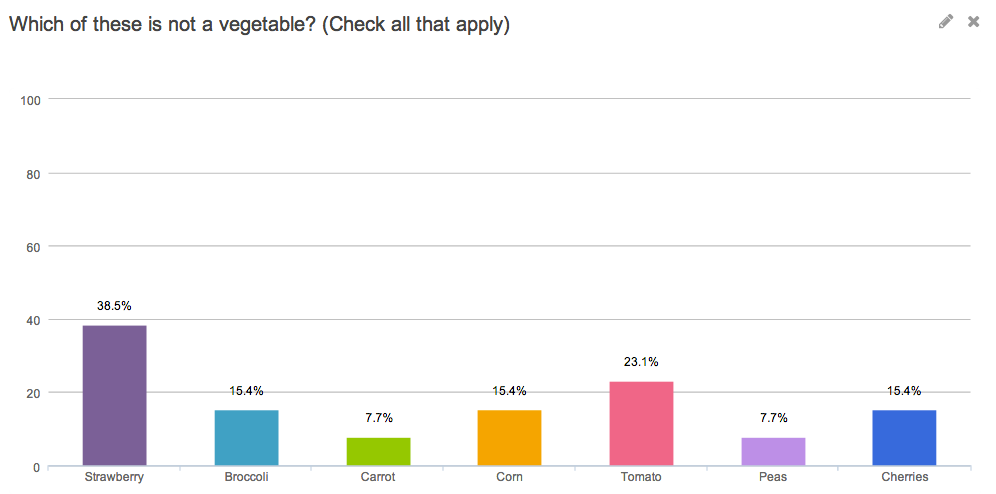
Vertical Bar Graph
Use Vertical Bar Graphs to report on multi-select questions. This will also work to report on other question types with a discrete list of answer options such as Multiple Choice, Dropdown Menus, Likert, and single Image Selects.
Default Questions:
- Checkboxes
- Image Select (Multi)
Other Compatible Questions:
- Radio Buttons
- Dropdown Menu
- Dropdown Menu List subquestions
- Image Select (Single)
- Rating (Likert Scale)
- Checkbox Grid rows
- Radio Button Grid rows
- Textbox questions or Textbox List subquestions with autocomplete values
Options available for Bar Graphs:
- Headline - This defaults to the question title. You can modify this in your Summary Report.
- Number - Your report elements are numbered consecutively by default if you indicated you wanted question numbers when you created your report. You can customize the numbering for each report element using this option.
- Text - Use the text field of each report element to add details, description, interpretation, etc.
- Answer Titles - This will display the answer option displayed to the survey taker in your report. Toggle this setting off if you would like to display reporting values instead
- Options in graph - This will keep the system from combining answer options with smaller percentages together. All options will be displayed in the graph.
- Table Title and Chart Title - Remove numbering and title from the table and/or chart.
- "Other" open-ended answers - Show a table of "other" open-text answers under the main report element.
- Hide response counts - This will hide the response count for this element.
- Graph display - Choose whether responses are graphed based on Percentage or Number of responses
- Order By - Select how you would like the answer options to be ordered; either by Original answer order, Number of responses, or Alphabetically by answer title.
Available Statistics:
- Total Responses
- Skipped count
If reporting values are numeric
- Sum
- Average
- StdDev
- Max
- Min
What does it look like in my Summary Report?
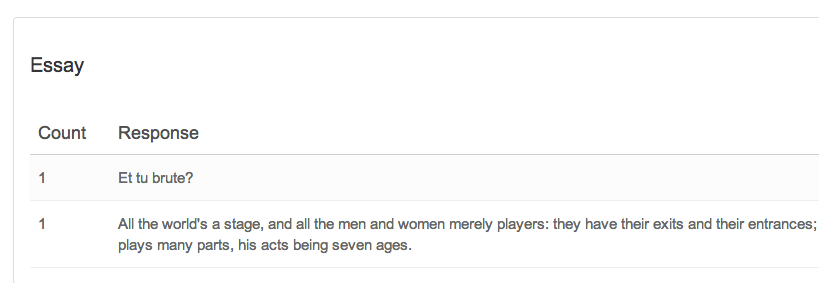
Appendix
Use Appendices to report on open-text questions.
Default Questions:
- Textbox (including number, email, percent, date and currency)
- Essay/Long Answer
- Textbox List
- All Contact Group fields
- URL Variables
Other Compatible Questions:
- Radio Buttons
- Image Select (Single)
- Dropdown Menu List (This will report each row in an appendix)
- Rating (Likert Scale)
Options available for Appendices:
These additional settings are found in the element set up.
- Headline - This defaults to the question title. You can modify this in your Summary Report.
- Number - Your report elements are numbered consecutively by default if you indicated you wanted question numbers when you created your report. You can customize the numbering for each report element using this option.
- Text - Use the text field of each report element to add details, description, interpretation, etc.
- Hide response counts - Note the response count feature is not working for Appendices at this time; response count does not display regardless of this setting.
- Show the Response IDs - Show the response ID next to each row of the appendix
- Sort by - By default, appendices sort alphabetically by answer text, if the Show Response IDs option is selected you can choose to sort by Response ID.
What does it look like in my Summary Report?
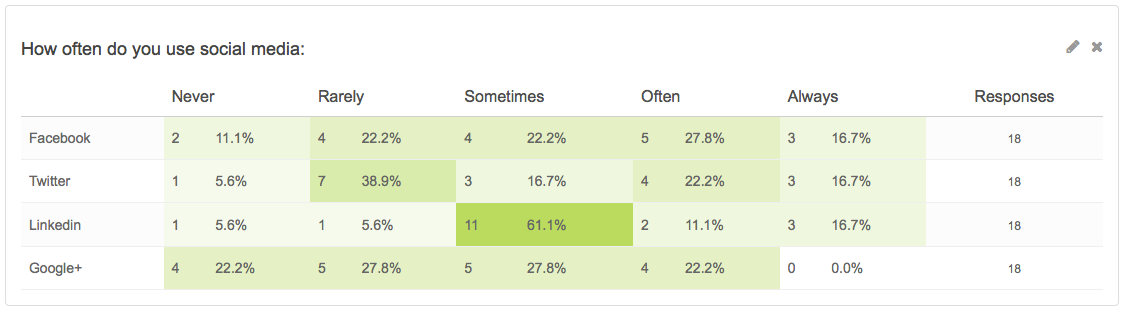
Table
Use tables to report on multi-dimensional questions.
Default Questions:
- Dropdown Menu List
- Drag & Drop Ranking
- Ranking Grid
- Continuous Sum
- Star Rating Grid
- Checkbox Grid
- Radio Button Grid
- Dropdown Menu Grid
- Textbox Grid
Options available for Tables:
- Headline - This defaults to the question title. You can modify this in your Summary Report.
- Number - Your report elements are numbered consecutively by default if you indicated you wanted question numbers when you created your report. You can customize the numbering for each report element using this option.
- Text - Use the text field of each report element to add details, description, interpretation, etc.
- Answer Titles - This will display the answer option displayed to the survey taker in your report. Toggle this setting off if you would like to display reporting values instead
- Options in graph - This will keep the system from combining answer options with smaller percentages together. All options will be displayed in the graph.
- Table Title and Chart Title - Remove numbering and title from the table and/or chart.
- "Other" open-ended answers - Show a table of "other" open-text answers under the main report element.
- Hide response counts - This will hide the response count for this element.
Available Statistics:
Multiple Choice Table with numeric reporting values only
- Show Averages for Table Rows
- Show Averages for Table Columns
What does it look like in my Summary Report?
Each question's table format is unique. Below is how the multiple choice table reports.
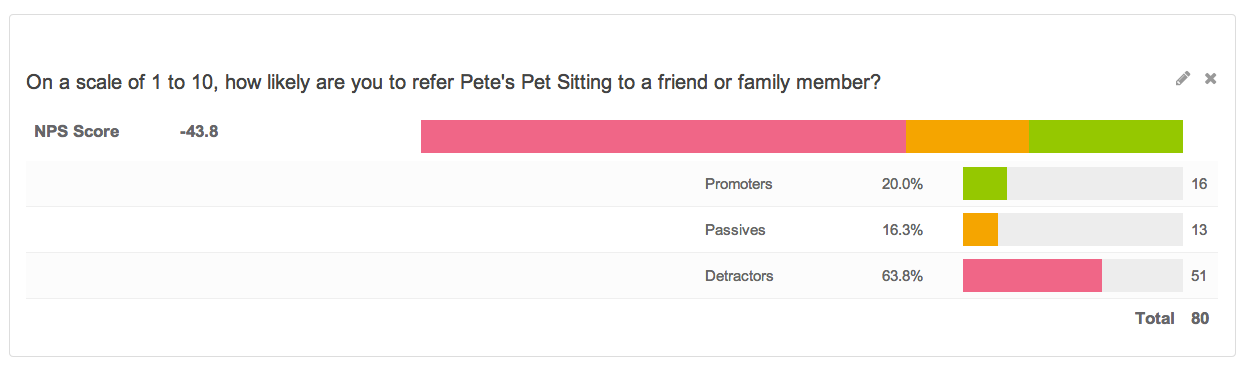
Net Promoter Score®
The net promoter score reporting element is used to report on net promoter score questions with a scale of 0-10.
Default Questions:
- Net Promoter Score
Other Compatible Questions:
- Rating (Likert Scale) with reporting values 0-10
Options available for Net Promoter Score:
- Headline - This defaults to the question title. You can modify this in your Summary Report.
What does it look like in my Summary Report?
The Net Promoter Score reporting element will display an Net Promoter Score as well as a count and percent of promoters, passives, and detractors.
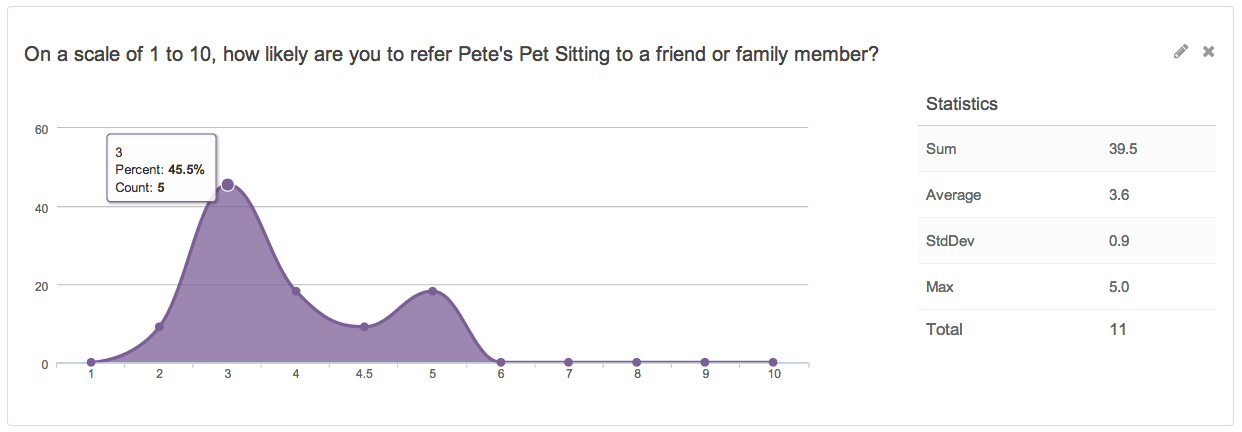
Area Chart
Default Questions:
- Slider (Single)
- Slider (Multi)
Options available for Area Chart:
- Headline - This defaults to the question title. You can modify this in your Summary Report.
- Text - Use the text field of each report element to add details, description, interpretation, etc.
What does it look like in my Summary Report?
The Area Chart for a single slider will display the range you specified for your slider. For each value entered you'll have a percent and count of responses.
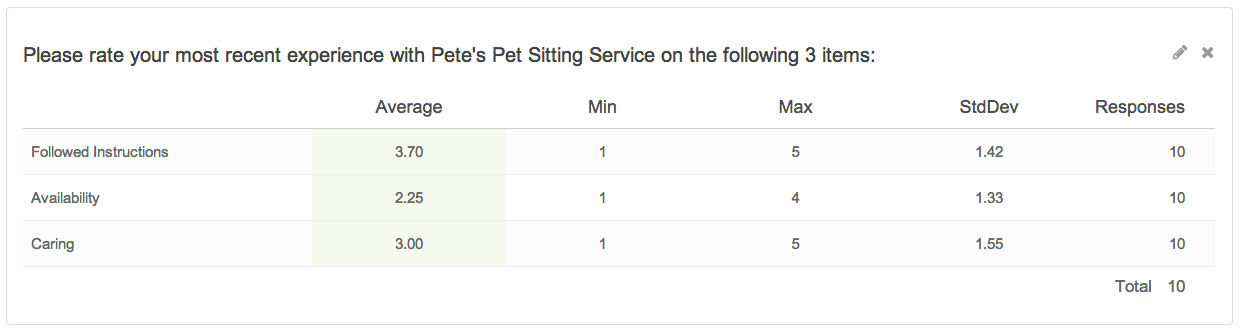
The Area Chart for a multi slider will display a table with the average, min, max, standard deviation and number of responses for each row in your multi slider.
Advanced Appendix Element
Use Advance Appendices to customize how you would like to report on your data. This works really nicely for contact groups but, you can use it for most other questions in your survey to meet your reporting needs.
Note: With the exception of checkboxes and table of checkboxes, all questions can be included in your custom reporting group.
Compatible Questions:
Advanced Appendices work best with open text fields and single select questions. You can technically pull data from all question types except Checkboxes, Checkbox Grid, Other Textboxes, Max Diff, and Conjoint Experiment, though the data from questions like Drag & Drop Ranking and Grid questions will not be terribly meaningful in this format.
Add-as-Needed data is not available for reporting using the Advanced Appendix Element.
Options available for Advanced Appendix Elements:
- Headline - Add a headline for your Advanced Appendix reporting element. There is no default headline for Advanced Appendices.
- Number - Number your Advanced Appendix reporting element if you wish. There is no default number for Advanced Appendices.
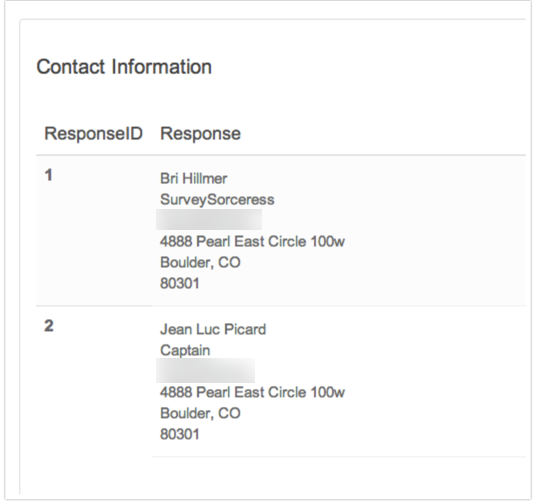
What does it look like in my Summary Report?
Advanced appendix elements display in a table format. The first column displays the Response ID and the second column displays the response data you selected in the format you indicated.
Set Up an Advanced Appendix Element to Report on Response Data Together
1. Create a new Summary Report or edit an existing Summary Report.
2. On the General tab click Add Element.
3. Select Advanced Appendix from the Element Display Type dropdown.
4. Give your report a Headline and a Number.
5. Set up your Source Questions/Data.
a. In the first dropdown select your first source question, for example, First Name.
b. In the second dropdown select the formatting you would like to follow the source question (choose from: Line break, Space, Hyphen, Comma, Colon, Semicolon) and click the link to Add.
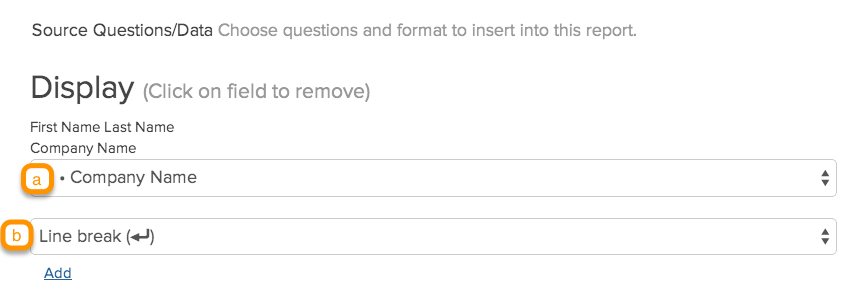
6. The source questions and formatting you selected will populate the Display field. To delete a source question, simply click the source question in the Display field.
7. Rinse and repeat until you have all of the contact form data you wish to report on and click Save.
8. Click Save on the General tab.
9. Click Run Report or Refresh data.
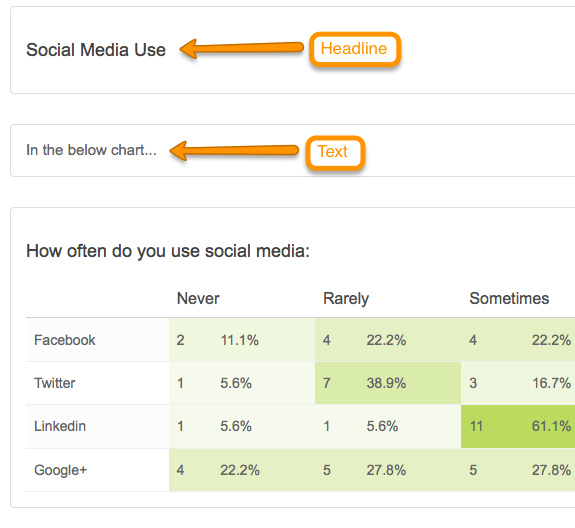
Headline & Text
Use Headline elements to organize and title subsections of your Summary Report. These are also useful in combination with Piped Page elements.
Use Text elements to add content to your Summary Report. This is useful for adding a description or interpretation of the data in your reports or illustrative anecdotes from open-text responses.
What does it look like in my Summary Report?
Setup
1. To set this up click Customize Report and scroll to the bottom of your General tab and click Add Element.
2. Select Cross Tab in the Element Display Type dropdown.
3. Add your text or headline and click Save.
4. This will add your text element to the bottom of your list of reporting elements on the General tab. Reorder your headline or text element so it displays where you would like!

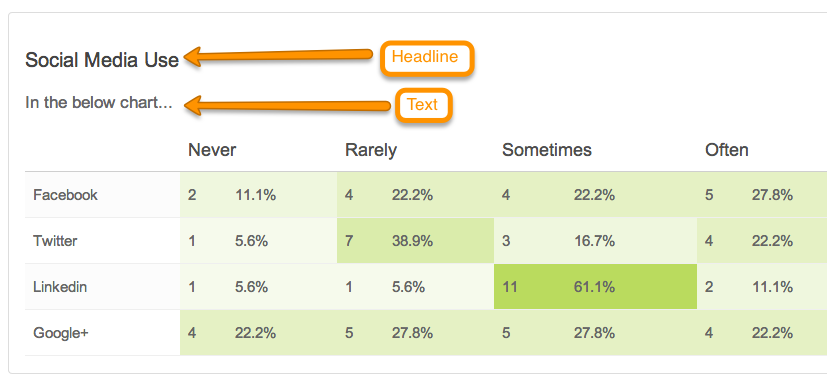
Headline and Text elements are also available as part of each reporting element itself. Simply click the pencil icon to edit a given element and customize the Headline and Text.
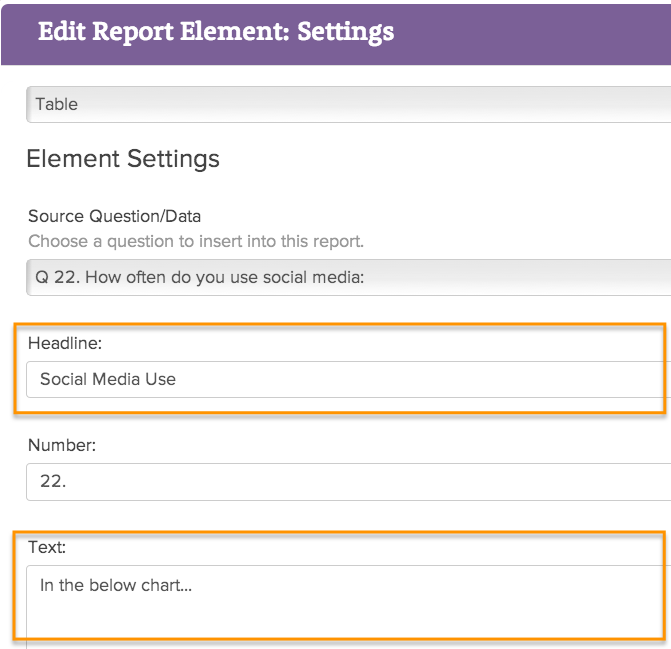
These will display as part of the reporting element itself.
Existing Report
Existing Report elements are used to pull data from an existing Summary Report into a new Summary Report.
Options available for Existing Report elements:
- Headline - Existing Report elements pull the Summary Report Title by default. Use the headline to further delineate the included report. (Note: Unfortunately, this feature is not working at this time. We'll look into getting this fixed up!)
What does it look like in my Summary Report?
Existing Report elements will pull in the title from the source report and display all reporting elements from that report. Learn how to set this up: Pull Data from an Existing Report.
Quotes
Within individual responses you can highlight portions of the text that are particularly relevant to your project as quotes to be used in final reports.

The Quotes reporting element will pull the quotes you've highlighted into your Summary Report. Quotes allow you to be selective about which comments are included in the report and link back to the original response, should you want to see everything a respondent said.
Compatible Questions:
- Essay/Long Answer
Options available for Quotes:
These additional settings are found in the element set up.
- Headline - This defaults to the question title. You can modify this in your Summary Report.
- Number - Your report elements are numbered consecutively by default if you indicated you wanted question numbers when you created your report. You can customize the numbering for each report element using this option.
What does it look like in my Summary Report
You're quoted text will display along with the date of the response. If you used email campaigns, the respondent's email address will display below the quote. If you used a link, embed, or other share method, the response ID will show.
 *
*
*At this time, there is not a way to choose whether the response ID or email address displays but you can hide it in you report share links by placing this CSS code under Customize Report > Style > Appended CSS.
.quote-data .quote-id {
display: none;
}
Piped Page
If you're using Page Piping in your survey, a Page Piped Container will automatically be added to any Summary Report you create. This container will show charts for each of the questions on a piped page, repeated for however many options are available from the source question.
Options available for Piped Pages:
If you edit this element once it's added to the report, you will see an additional set of options!
- Piped Pages - This is where you'll select which piped page you'll be reporting on.
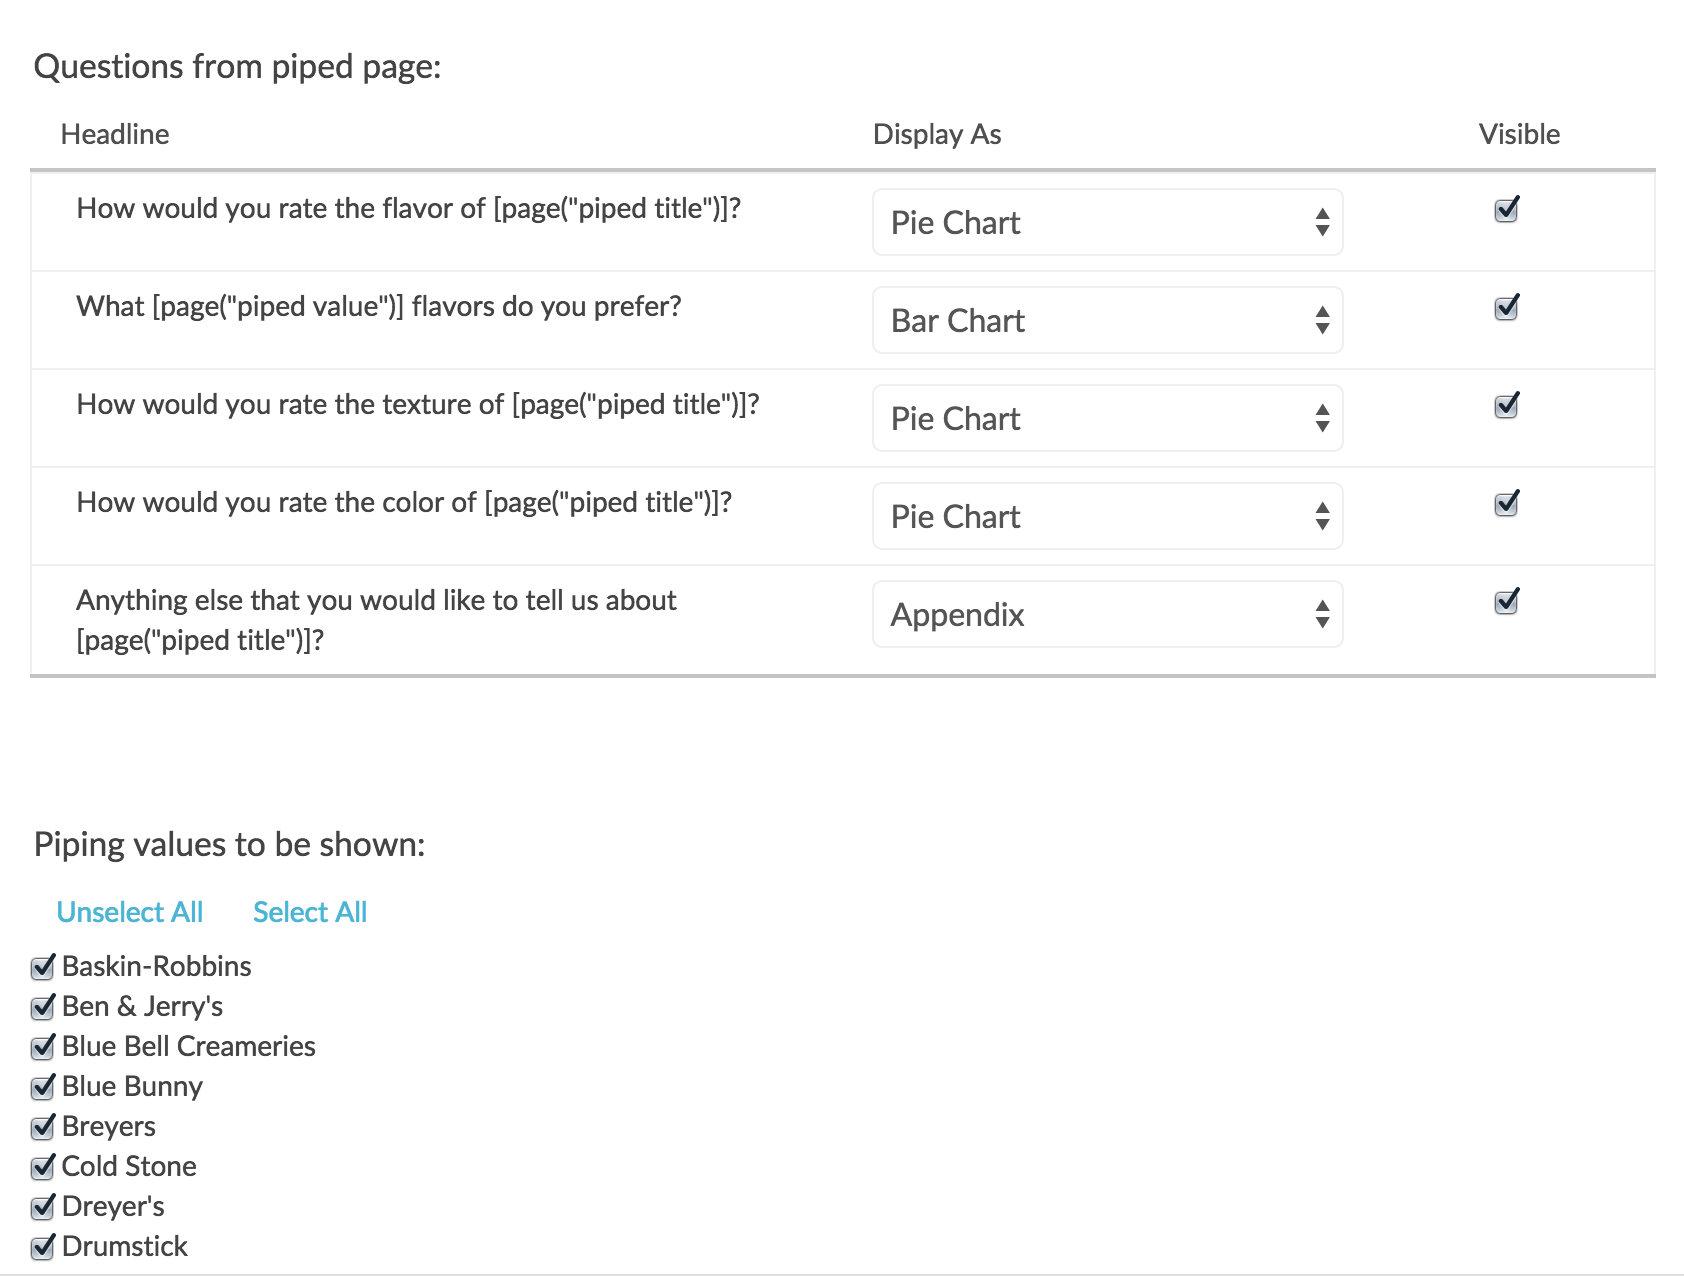
- Display as - Under the Questions from piped page heading, you'll be able to choose which chart type is used. You can also toggle whether or not this option is visible in this area.
- Piping Values to be shown - In this area, you can select which piped values you want to see. When the element is created, all options will be selected. You can remove piped values to essentially filter which piped pages appear in a report.
Net Promoter, Net Promoter System, Net Promoter Score, NPS and the NPS-related emoticons are registered trademarks of Bain & Company, Inc., Fred Reichheld and Satmetrix Systems, Inc.
Admin
— Bri Hillmer on 05/27/2016
@Habib-Sylvain: This is great feedback! There are more reporting customization options in the Legacy Summary Report. I'll report this to the development team and see what we can do to get these same customization options in the Standard Report.
Bri
Documentation Coordinator/Survey Sorceress
SurveyGizmo Customer Support
— Bi on 05/26/2016
Why is the "Net Promoter Score" format not available for "Rating (Likert Scale) with reporting values 0-10" in the "Standard" version, when it was available in the "Legacy" one?
Same for the "Vertical Bar Graph" on "URL variables".
Will we get these features back before the "Legacy" report format is entirely removed?
Admin
— Bri Hillmer on 02/08/2016
@Craig: We do not currently have radar charts available for reporting but the good news is our development team is currently looking into improvements like allowing for different chart types. What question type were you looking to report as a radar chart? I'll be sure to pass this along to our development team!
Bri
Documentation Coordinator/Survey Sorceress
SurveyGizmo Customer Support
— Craig on 02/08/2016
I want to create a radar chart, is that possible?
Admin
— Bri Hillmer on 10/05/2015
@Anna: I'm sorry to say that this level of customization is not available with the advanced appendix element. I'll be sure to make note of it for discussion of future improvements with the development team.
Thanks for checking out our documentation!
Bri
Documentation Coordinator/Survey Sorceress
SurveyGizmo Customer Support
— Anna on 10/01/2015
When using the advanced appendix element, is there a way to include a header for each of the data elements included. For instance, in the contact information example above, is there a way to include Name, Company, etc. next to each of the individual rows/data element included for Contact Information (basically the name of the field listed)? Also, is there a way to put a blank row in between each of the rows?
Admin
— Bri Hillmer on 06/29/2015
@Sarah: Thanks for taking a look at our documentation. If your question has numeric reporting values the average should be included automatically!
Here is our documentation on the available statistics for each question:
http://help.surveygizmo.com/help/article/link/summary-report#customize-or-exclude-statistics
Here is our documentation on customizing reporting values:
http://surveygizmov4.helpgizmo.com/help/article/link/define-your-own-reporting-values
I hope this helps!
Bri
Documentation Coordinator/Survey Sorceress
SurveyGizmo Customer Support
— Darren on 06/29/2015
Do you have a graph that allows you to see the average score from all the responses?