Before making decisions based on your survey data it is a good practice to clean your data. This is particularly true if you used panel respondents or provided an incentive to increase your response rate. Using our Data Cleaning Tool you can identify and remove responses with poor data to ensure you are making decisions based on the best data possible.
Before we get started discussing the tool itself, we should start by discussing the data cleaning. Cleaning survey data is a subjective process. This means it almost always requires a human to make final judgments on the quality of each response. We've provided a tool that helps to automate the decisions you make, but we can't do it without you. Every poor data flag will not apply to every survey. If you choose to check off all the poor data flags you will, most likely, not be satisfied with the results.
Instead, for the best results, you should consider your survey and your respondents. Think about what data and respondent behaviors will skew your results and use the tool to look for those poor data flags.
The Data Cleaning tool is not available for surveys created before the release of this feature on October 24, 2014. If you wish to still use this tool for surveys created prior to the release of this tool simply copy the survey and import the data. With the exception of the speeding tool, all other tools will be available to use after importing the data.
Surveys created after this date will show the option to clean data once you have collected 25 live (non-test) responses. To get started, go to Results > Quarantine Bad Responses.
Step 1: Speeding
The data cleaning process starts with identifying respondents who sped through your survey. We start with this step because speeding is one of the most serious indicators of poor quality data. Respondents who proceed through your survey faster than others are likely not carefully reading your questions. This generally means that their answers are less accurate.
In the speeding step, the distribution of average response time per question will be charted for you. This is computed for each response by taking the total response time divided by the number of questions that that respondent was shown. The chart will start with a red line, used to eliminate speeders, at the fastest 1% of responses and a blue line, used to normalize slow outliers, at the slowest 10% of responses.
- To get started, click and drag the red line to quarantine the fastest responses. You will most likely make the decision of the placement of the red line based on the curve of the data, but remember to keep an eye on the percentage and number of responses you are quarantining.
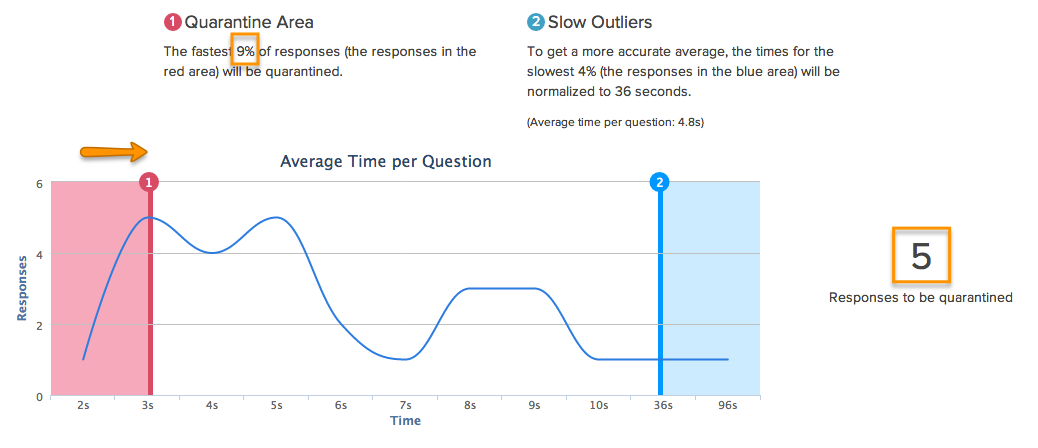
- Next, click and drag the blue line to the left if you wish to normalize the average per question response time. All responses in the blue area will be given the max average per question response time indicated by the blue line. Keep an eye on the percentage of responses you are affecting and the change in the average time per question as you make these adjustments.
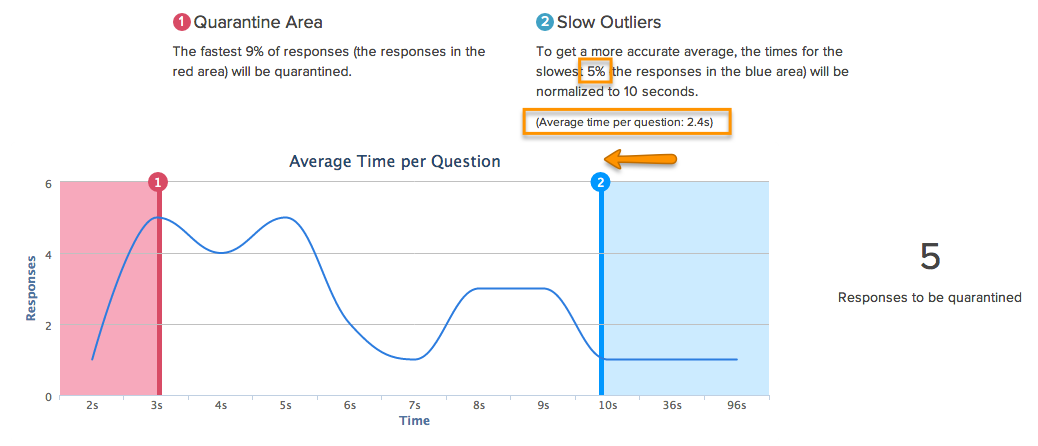
- Once you are satisfied with your adjustments to average time per question and the responses that are quarantined as a result, click Next to move on to evaluating answer quality.
Step 2: Answer Quality
In the answer quality step of the data cleaning tool, the remaining responses that were not quarantined for speeding can be further evaluated for data quality. There are 8 possible indicators of poor data.
Each poor data quality flag has a default flag weight. If you wish to change the importance of any these poor data flags you can increase the importance by increasing the flag weight or decrease it by assigning a lower flag weight.
Below we discuss each of your poor data quality indicators.
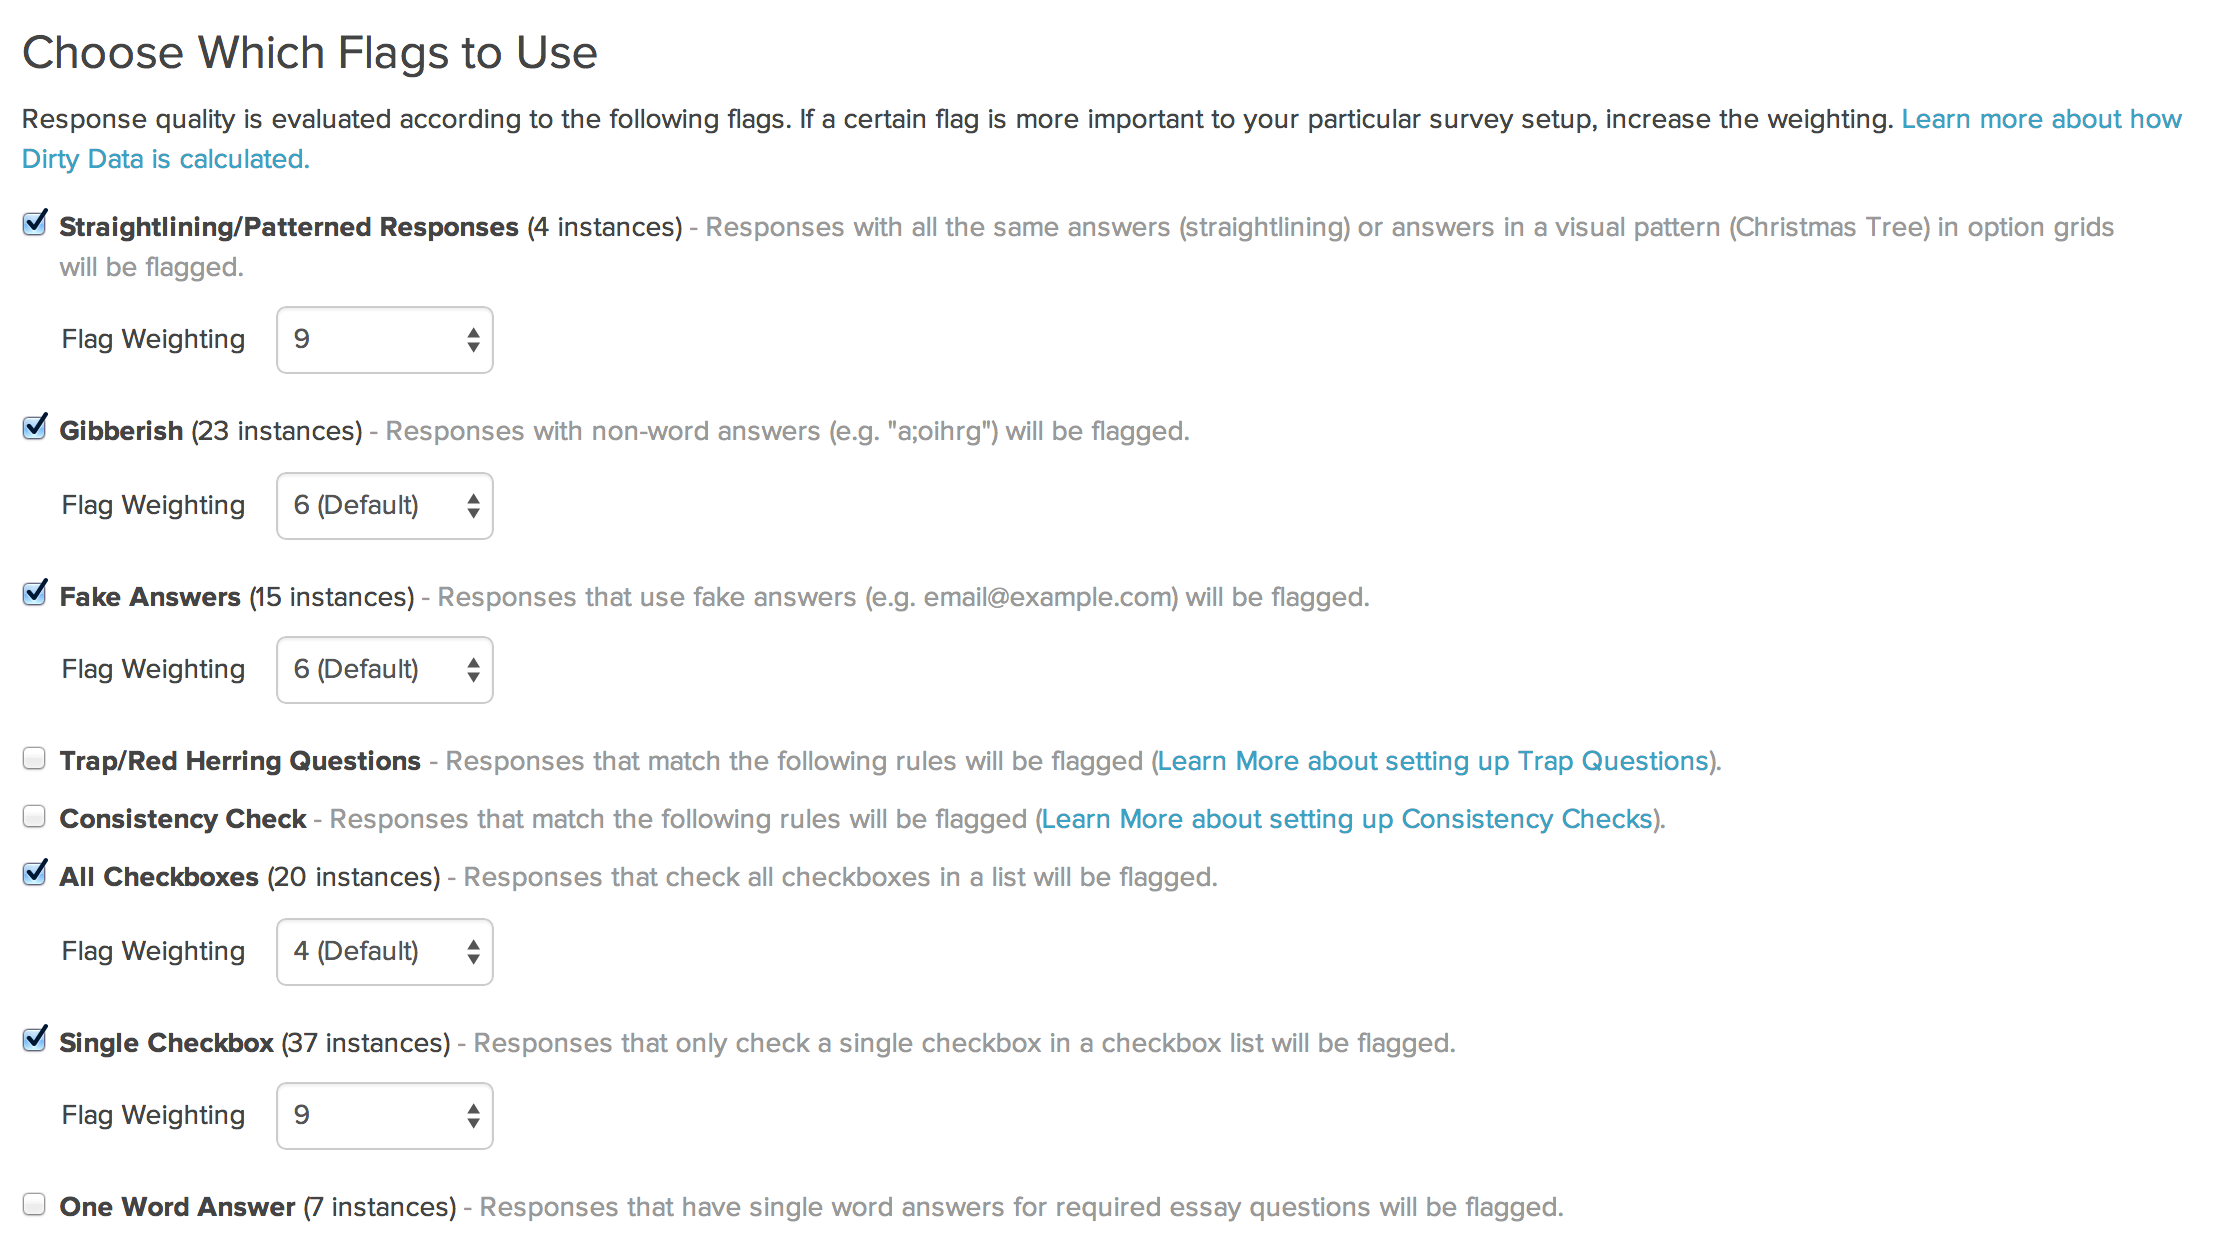
Straightlining/Patterned Responses
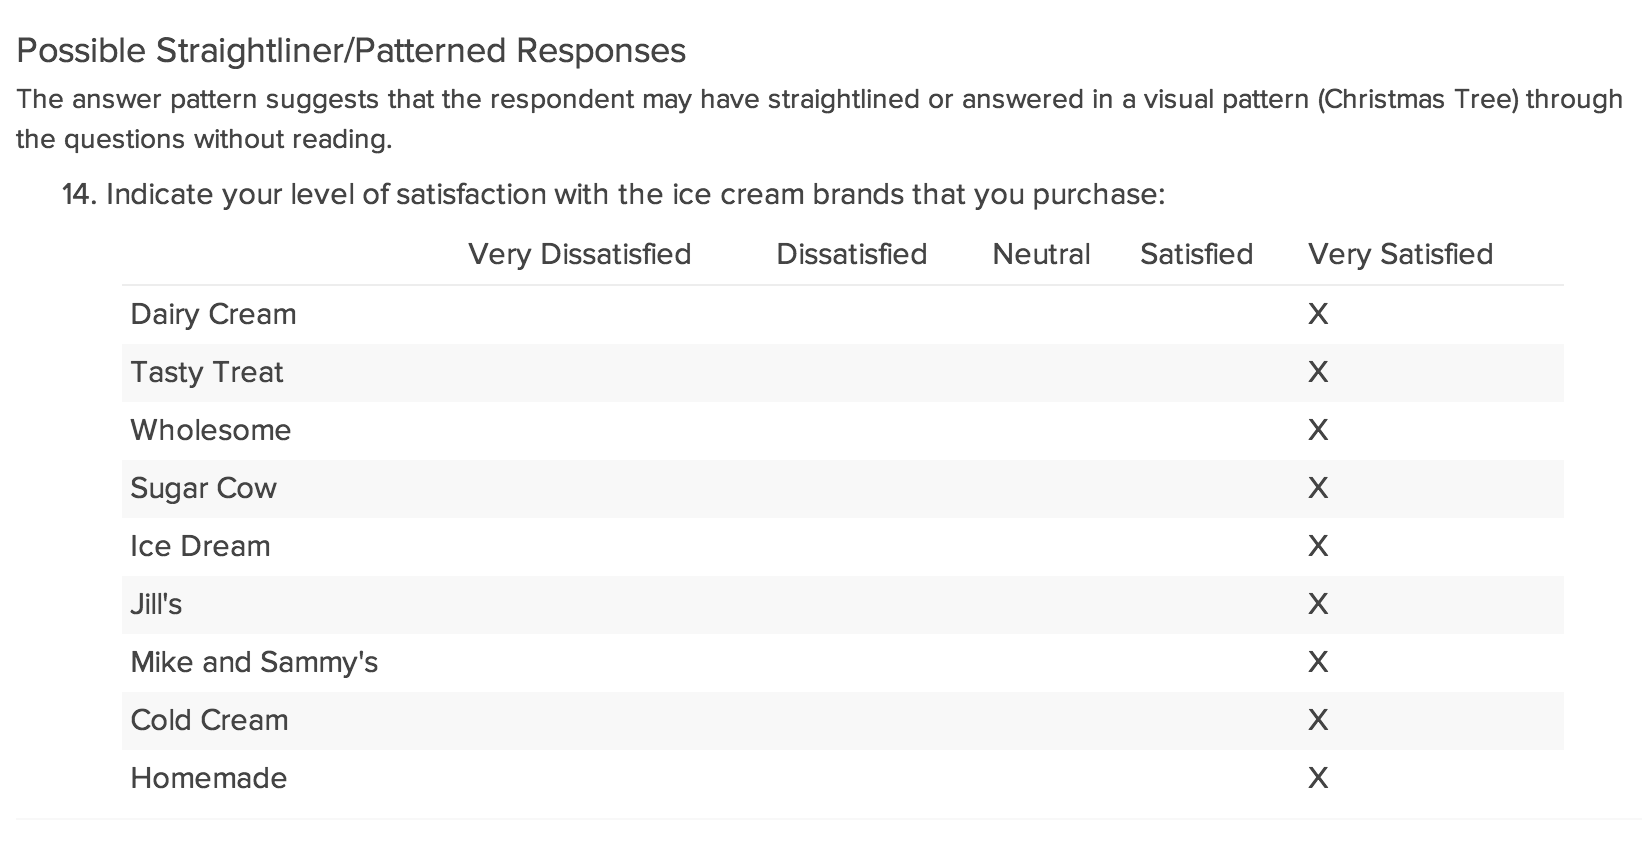
Responses in option grids with all the same answers (straightlining) or answers in a pattern may indicate that the data may not represent the respondent’s actual opinion. Both straightlining and patterned response behavior are methods used by respondents to complete surveys as quickly as possible. This behavior is usually motivated by incentives.
Responses with instances of this behavior will be flagged by default. The number of instances detected across all responses will be available to the right of the flag label. This flag will even work for grid questions with rows that are randomized as the flag is set as part of the response itself.
If you wish to turn this off, you can do so by unchecking the checkbox.
Questions evaluated: Radio Button and Checkbox grid questions with more than 4 rows.
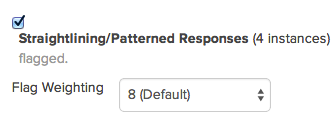
How it works: A response receives a straightline flag for each grid question where more than half of the rows answered the same. A response receives a patterned response flag for each grid question where every answer is within one step from the previous row's answer.
Gibberish
Nonsense answers to open-ended questions may indicate that the respondent was keyboard mashing and was not engaged.
Responses with instances of this behavior will be flagged by default. The number of instances detected across all responses will be available to the right of the flag label.
If you wish to turn this off, you can do so by unchecking the checkbox.
Questions Evaluated: All open-text fields.
How it works: Open-text responses with less than 7 words are evaluated and matched against an English language dictionary. Responses receive a gibberish flag for each open-text field answer with less than 7 words that contains non-words, for example, "lkaghsd." This flag will not work as well with non-English language responses, especially non-roman character sets. No need to worry though about false positives, responses with non-roman character sets will be ignored.

Fake Answers
Fake answers (e.g. email@example.com, lorem ipsum, test, etc.) to open-ended questions may indicate respondent did not provide truthful answers elsewhere in the survey.
Responses with instances of this behavior will be flagged by default. The number of instances detected across all responses will be available to the right of the flag label.
If you wish to turn this off, you can do so by unchecking the checkbox.
Questions Evaluated: All open-text fields.
How it works: Open-text responses with less than 7 words are evaluated and matched against typical dummy answers, such as, lorem ipsum, test, etc. Responses receive a fake answer flag for each open-text field answer with less than 7 words that contains dummy words.

Trap/Red Herring Questions
Trap or red herring questions can be added to surveys and used to filter out responses from disengaged respondents.
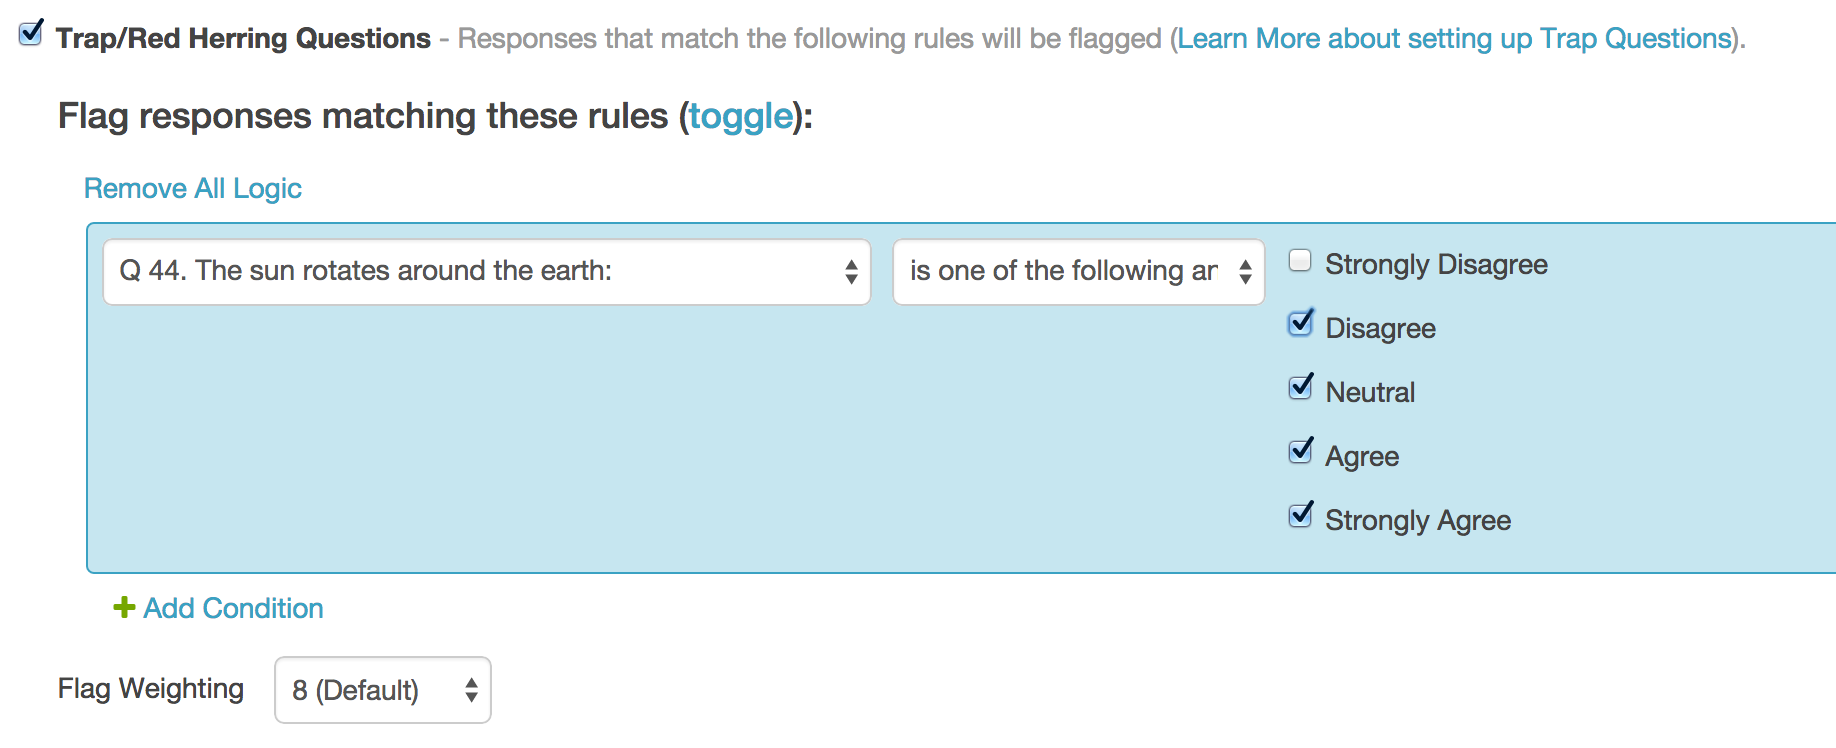
To use this data cleaning flag, check the checkbox. Next, use the logic builder to set up the rules for responses you wish to flag.
Say, for example, we added a question to a survey that asks respondents to agree or disagree with the statement "The sun rotates around the earth."

Then we can set up a logic rule to flag any responses to this red herring question that are anything other than Strongly Disagree.
Consistency Check
Similar to trap/red herring questions, consistency checks can be added to surveys and used to filter out responses from disengaged respondents. While red herring questions can be cognitively taxing and might foster distrust, consistency checks are less conspicuous to survey respondents.
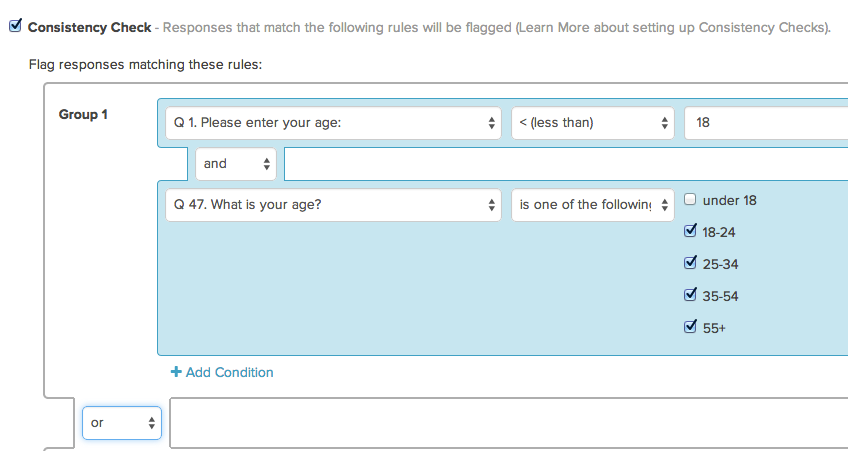
To use this data cleaning flag check the checkbox. Next, use the logic builder to set up the rules for responses you wish to flag.
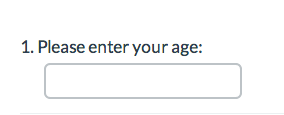
Say, for example, we asked an open-text age question at the beginning of the survey.
And, later in the survey, we asked an age question with age ranges as answer options.

We can set up logic rules to flag responses in which the answers to these two questions were inconsistent.
All Checkboxes
Another possible indicator of poor data quality is checkbox questions with all answers selected. For example, if your survey is about the NFL you might include a screener question to ensure that your respondents are NFL fans. Respondents, particularly panel respondents and respondents who are motivated by an incentive, will often select all options in a screener question so that they qualify to continue the survey.
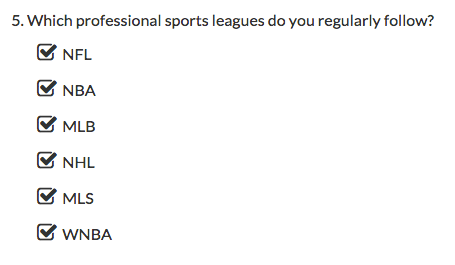
Responses with all checkboxes checked are may also indicate that web-browser form-fill tools have been used. This is especially true when the answer list includes Not applicable, Other, or None of the above.
To use this data cleaning flag check the checkbox. The number of instances detected across all responses will be available to the right of the flag label.
Questions Evaluated: Checkbox questions

Single Checkbox
Checkbox questions with a single option selected in specific scenarios may indicate poor data quality. Professional survey panelists often understand that some surveys will disqualify them if they don't check anything on a screening question. To circumvent this, they will just mark one answer to ensure they can proceed.
If you decide to use this flag it is best to be used in conjunction with other flags as a single checkbox response alone is not usually enough to quarantine a response.
To use this data cleaning flag check the checkbox. The number of instances detected across all responses will be available to the right of the flag label.
Questions Evaluated: Checkbox questions

One Word Answer
Single-word answers to open-ended questions may indicate either that a web-based form-filler has been used to record a response or that your respondent was not engaged.
To use this data cleaning flag, check the checkbox. The number of instances detected across all responses will be available to the right of the flag label.
Questions Evaluated: Required Essay/Long Answer questions

Choosing Quarantine Threshold
Once you are finished choosing the flags you wish to use and customizing their weights, scroll down to choose your quarantine threshold. In most cases, you will have made changes to the data flags that require the chart to be refreshed.
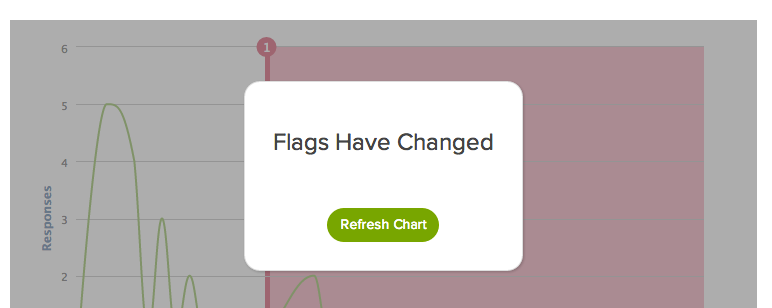
The Dirty Data Scores for your data set will be charted on the x-axis with the number of responses charted on the y-axis.
- Click and drag the red line to quarantine responses with high Dirty Data Scores. Responses in the red area will be quarantined and removed from your results.
- When you are satisfied with the responses to be quarantined, click the Quarantine button.
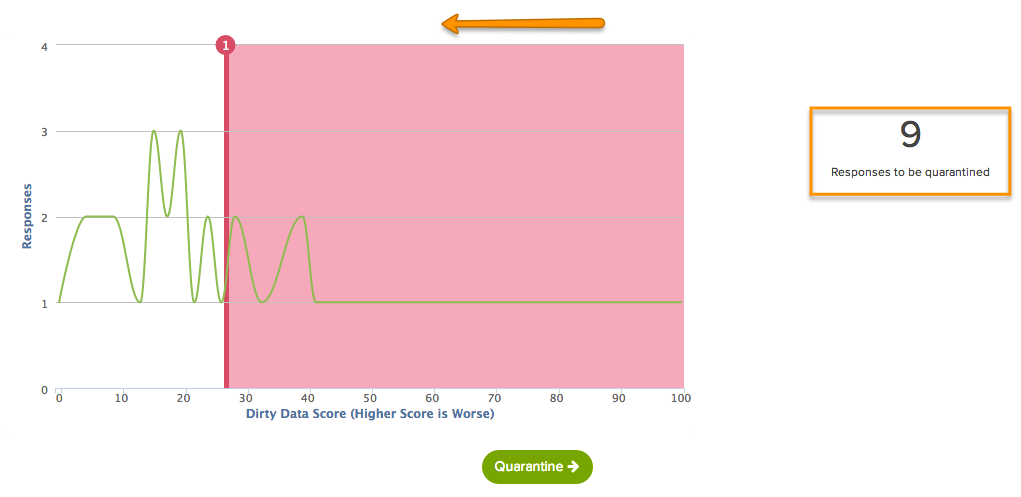
How are the dirty data scores calculated?
A Dirty Data Score is calculated for each response using the flags that you enabled. Each flag is multiplied times the weights that you selected for each flag type. All Dirty Data Scores are normalized on a curve so that the response with the highest score receives a 100 and the response with the lowest score receives a 0.
For example:
+ 1 straightlining instance x flag weight of 8
+ 3 gibberish instances x flag weight of 6
+ 2 fake answers x flag weight of 6
+ 5 all checkboxes x flag weight of 4
+ 6 one word answers x flag weight of 4
______________________________________
= Dirty Data Score 82 (before normalization)
Step 3: Results
Your data cleaning results will show how many responses have been quarantined.

From here you can choose to:
View Quarantined List
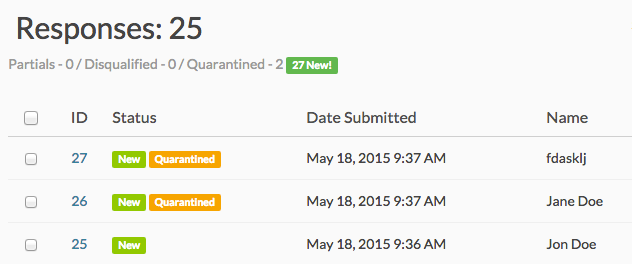
This link will take you to the Individual Responses page where the quarantined responses will be flagged as Quarantined.
Export Quarantined Responses
This link will download your quarantined responses to an Excel spreadsheet.

Each Data Cleaning category is displayed as a column in the export with a count of instances for each response. For example, in the screenshot above the response in row one has one instance of fake answers whereas the response in row two has three instances of gibberish answers.
Restore Quarantined Responses
This link will take the quarantine flag off of all responses that were quarantined during the data cleaning process. You can go through the quarantine process once more and adjust your flags if needed by clicking on the Start Over button on the data cleaning results page.
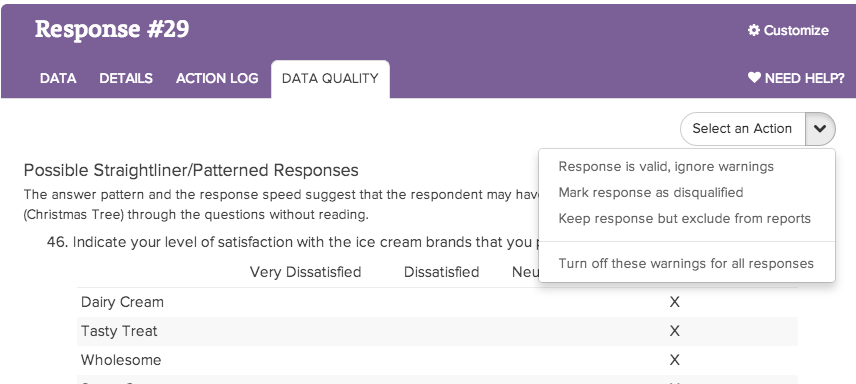
If you wish to add and remove individual responses from quarantine you can do so on the Data Quality tab of each response under Results > Individual Responses.
If you would like to adjust your data cleaning results, including how many responses are quarantined and the flags that determine dirty data, you can click the option to Start Over.

Reports and Exports of Cleaned Data
Once you have cleaned your data, responses flagged as quarantined will be automatically filtered out of your reports and exports. If you wish to include* these, go to the Filter tab of your report or export and uncheck the option to Remove Responses Flagged as Quarantined.
*The option to include quarantined responses is available in Legacy Summary Reports only.
FAQ
The option for Data Cleaning Tool is not available on my survey. What gives?
The data cleaning tool is available only for surveys created after the release of this feature on October 24, 2014. For surveys created after this date the option to clean data will only be available once you have collected 25 responses.
The Data Cleaning Tool is not compatible with the data encryption feature on the Survey Settings page.
What about randomization? Can the Pattern Flag still detect patterns in grid questions where rows are randomized?
Yes! Because the Data Cleaning Tool sets these flags in realtime as part of the response it can still detect patterns in grid questions with randomized rows. If you check out the Data Quality tab of an individual response you can verify that the response has been flagged for a pattern based on the order the question was displayed in the given response.
Can I remove the Quarantined flag from Individual Responses?
Yes! If you need to remove the Quarantined flag from a response, you can do so via Results > Individual Responses.
- First, you will need to make sure that you display the Quarantined Responses. Click on the Filtered link next to the search bar at the top of your response list.
- Next, check the box associated with Quarantined Responses and click the Apply button. Your quarantined responses will now show in your response list.
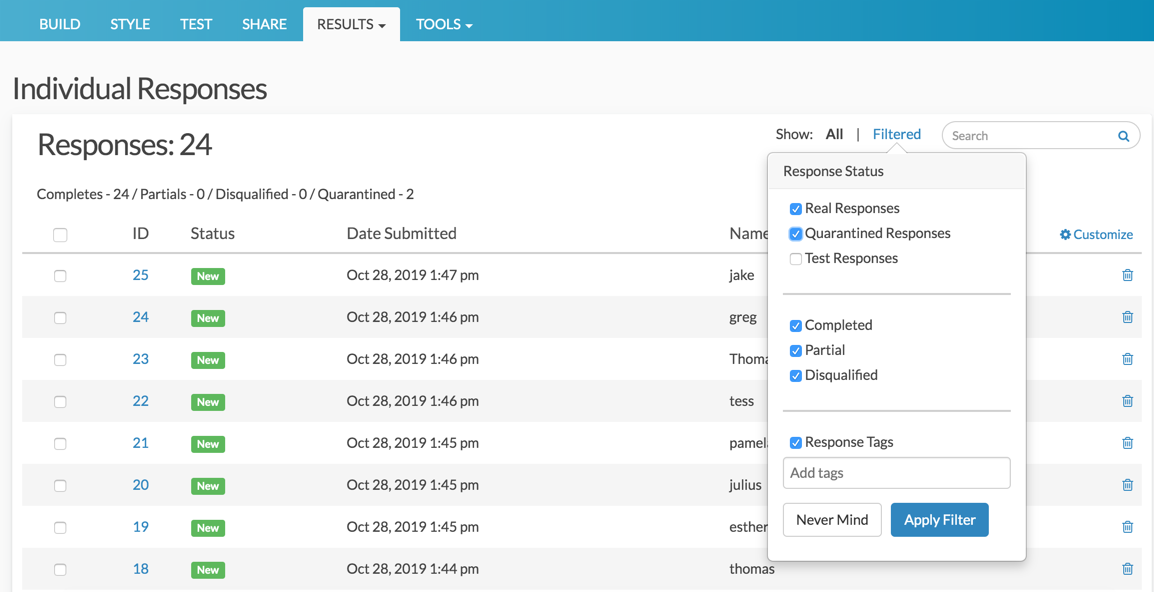
- Next, access the response in question by clicking on that response in the list. This will open the response details.
- Finally, access the Data Quality tab and use the Select an Action menu to restore your response.


Admin
— Dave Domagalski on 10/28/2019
@Daniel: Thank you for your question!
Yes, it is possible to un-quarantine data. There are a couple of options for this. Once you have quarantined responses via the Data Cleaning tool, the Results page will provide an option to 'Restore quarantined responses'. This will restore all responses and is best used if you need to start over or simply restore all data.
The second option allows you to restore responses individually. This is done via Results > Individual Responses as described in this FAQ:
https://help.surveygizmo.com/help/data-cleaning#faq
I hope this helps!
David
Technical Writer
SurveyGizmo Learning & Development
— Futurum on 10/28/2019
Is it possible to un-quarantine data? I'm trying to quarantine data that in the "might be bad, but might be acceptable" category and may want to restore it later depending on if we're able to backfill with higher-quality responses. Thanks.
Admin
— Dave Domagalski on 09/09/2019
@CoverUS: Thank you for your question!
I'm afraid that data cleaning data is not available in real-time during survey taking and as such cannot be bassed back through a redirect.
I'm sorry for the trouble and hope this helps clarify!
David
Technical Writer
SurveyGizmo Learning & Development
— CoverUS on 09/09/2019
Upon completion our surveys redirect back to our own system and pass some URL variables back in the redirect. Is the Dirty Data Score (or any other quality metric/flag) available in real-time to be passed back through a redirect? Thanks.
Admin
— Dave Domagalski on 01/24/2018
@Mario: Thank you for your question!
I tested an offline survey and the Data Cleaning Tool currently does not work with offline responses. I have since alerted our Development team of this issue so that we can look into getting this addressed.
I'm very sorry for the trouble in the meantime!
David
Documentation Specialist
SurveyGizmo Customer Experience
— Mario on 01/23/2018
does the Data Cleaning Tool works on data collected from offline surveys?
Admin
— Dave Domagalski on 04/20/2017
@Brian: Thank you for exploring SurveyGizmo Documentation!
I'm afraid that the Data Cleaning Tool is not designed to bulk update data in the way that you have mentioned.
There are a couple of other options which may be worth exploring.
If you are looking to force respondents to enter these values as all-caps while taking the survey, the regEx validation described here should be a good option:
https://help.surveygizmo.com/help/textbox-answer-formats#setting-up-regex
There are links to further regEx resources available at the above link.
Additionally, if you are wanting to update already collected responses, the Data Import Tool is likely the best option.
You can utilize the 'Bulk Update' feature of the Data Import Tool to make changes to the open text fields that you are wanting to update.
I hope this is helpful!
David
Documentation Specialist
SurveyGizmo Customer Experience
— Tiffany on 04/20/2017
I would like to update values in a textbox to all upper case characters. I tried using JavaScript to do this but with no success. Is this something that I can do with data cleaning?
Admin
— Bri Hillmer on 01/10/2017
@Burnett.amy: You likely just need to refresh your export or create a new export to get your changes. I would recommend going to Results > Export to get your exported data rather than using the option under Results > Individual Responses.
Let us know if you continue to have trouble!
Bri
Documentation Coordinator
SurveyGizmo Customer Experience Team
— Burnett.amy on 01/10/2017
I am using Survey Gizmo to collect inputs for literature reviews. I am the only respondent to my "survey" and every time I find an article I would like to record, I fill out my own survey. Sometimes, I need to change former responses as new information becomes available. I update the records in Results -> Individual Responses. But when I try to export the results to a cvs file to manage locally, only the un-updated responses are exported. How do I update results, permanently?
Admin
— Bri Hillmer on 07/20/2016
@Tina.l.lavato.civ: You need to have 25 real (non-test responses). I took a quick peek at your survey and this looks like this might be the cause of the trouble. My apologies for the confusion! Fortunately you can convert test response to real responses:
https://help.surveygizmo.com/help/article/link/viewing-responses#converting-responses
I hope this helps!
Bri
Documentation Coordinator/Survey Sorceress
SurveyGizmo Customer Support
— Tina.l.lavato.civ on 07/20/2016
I have a survey with 34 responses but the data-cleaning tool is not enabled. What gives? I thought the minimum number of responses was 25.
Admin
— Bri Hillmer on 06/27/2016
@Strasser: The data quality info is returned in an array as part of the survey response object. I've not done too much with this information but it is worth investigating whether you can achieve what you are looking to achieve.
https://apihelp.surveygizmo.com/help/article/link/surveyresponse-sub-object-v5
Regarding the option to add dictionaries of other languages. This is a great idea; I will be sure to pass this request along to our customer experience team as a future improvement!
Bri
Documentation Coordinator/Survey Sorceress
SurveyGizmo Customer Support
— Jan on 06/27/2016
You say: "...data cleaning tool sets these flags realtime as part of the response ..." Is there a way to access these flags by your custom scripting API - e.g. to give an immediate feedback to the respondent during his session?
— Jan on 06/27/2016
Gibberish detection: is it possible to add dictionaries of other languages, e.g. German or French dictionaries?
Admin
— Bri Hillmer on 08/17/2015
@Daniel: Thank you for taking a look at our documentation! This is a great idea! Do you have an example where this tool that you describe is available? I would be happy to take a look and see if I can get something like this set up in our documentation!
Bri
Documentation Coordinator/Survey Sorceress
SurveyGizmo Customer Support
— Daniel Kauffman on 08/16/2015
Not just for this page but probably many more pages a tool should be added for easy access to information for citing purposes. For example you could add a tool that asks the reader if they want to cite the information in a paper, it asks them what style and then automatically gives them the information they need in the format they need it. This would go along way into making the site accessible and would be big kudos for your work being used for scholarly citation. A win/win for everyone. Just food for thought.