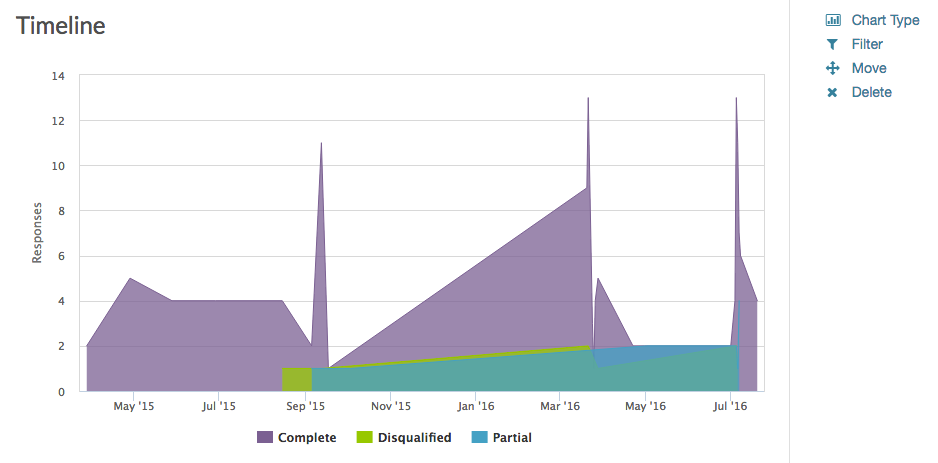
Standard Report: Response Timeline
The response timeline shows the number of responses (by status) that your survey has collected over time.
If you wish to add a response timeline to your report you can do so using the Insert Tool.
Available Options for the Response Timeline
There are a number of options available for an individual response timeline chart.
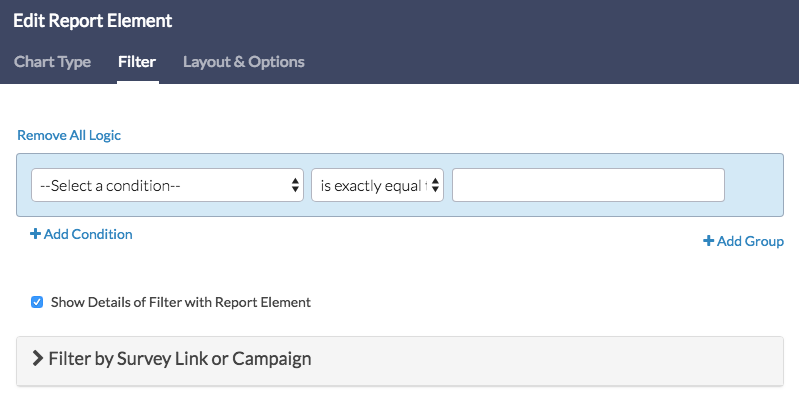
Filter Tab
First, if you wish to filter the data that displays for an individual response timeline, click Filter to the right of the element and use the logic builder. Learn more about filtering an individual element.
- If you wish to display the specific details of your filters below your chart check the Show Details of Filter with Report Element checkbox below the logic builder.
- You will also see an option to filter this element by Survey Link or Campaign. This filter option will allow you to only include data in this element that was collected via a specific link (or links).

