Do you need for your survey's report to correspond with your brand or perhaps your client's brand? You're in the right place; this tutorial covers the style options available in the Standard Report.
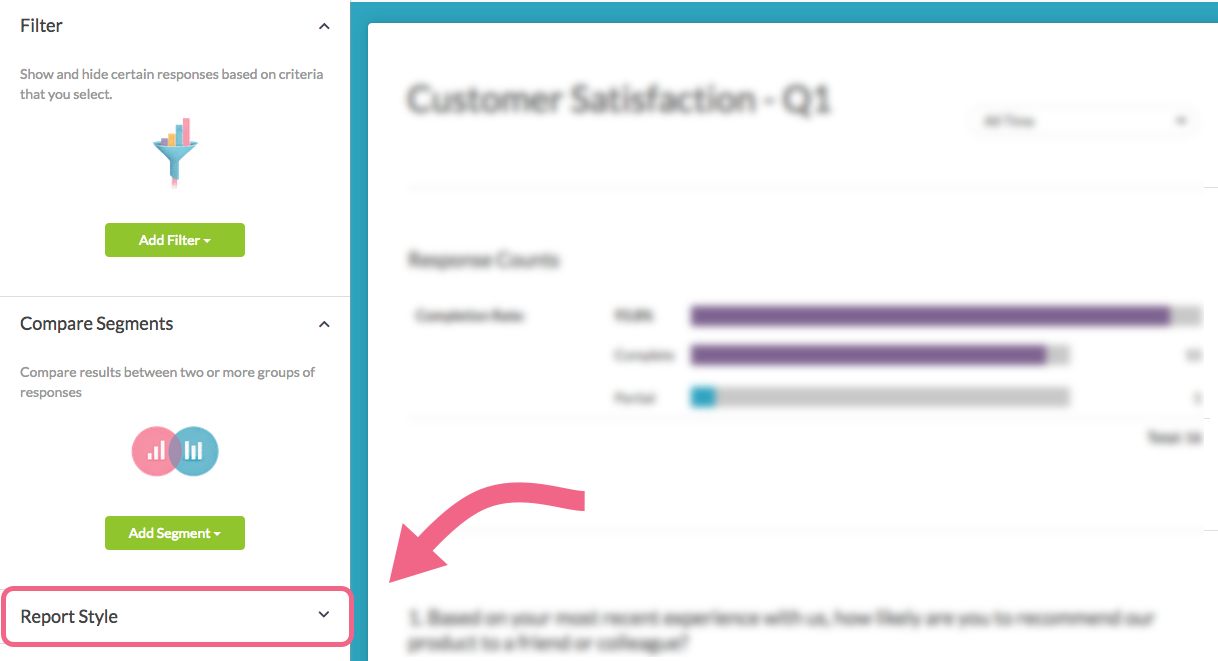
The Standard Report offers a number of style options for you to completely control the look and feel of the report. To get started, click the Report Style option in the left-hand panel of your Standard Report.
Themes
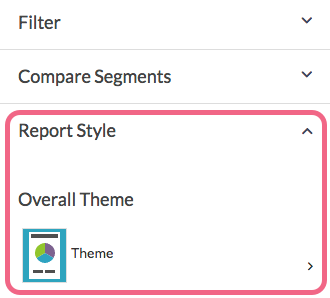
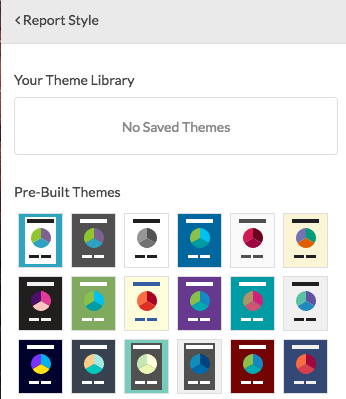
Get started styling your Standard Report by checking out our Pre-Built Themes. Navigate to Report Style > Theme > Pre-Built Themes and click a theme thumbnail to see it applied to your report.
Note: Applying a Pre-Built Theme to your report will update every visual aspect of the report, including changing the fonts, chart colors, and size of the text.
Logo
If you wish to include your brand's (or your client's) logo at the top of your Standard Report go to Report Style > Logo and click Add Image. There are several options for adding a logo:
- Select an image that has been previously uploaded to your File Library
- Upload an image directly via the Upload image file button
- If your image is hosted online, add it to the report via the Image URL field. Paste the image link/url into the field and click Insert Image to finish.
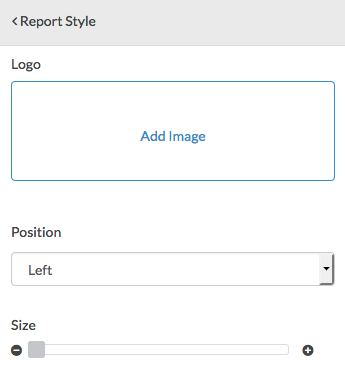
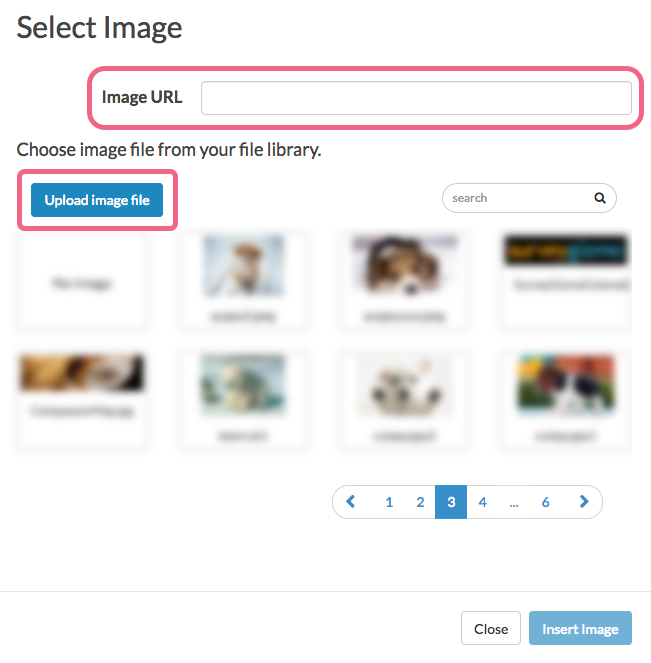
After adding your image, use the Position drop-down to set the image position as Left, Center, or Right. If you need to adjust the logo's size, use the Size slider to either increase or decrease the size.
Background
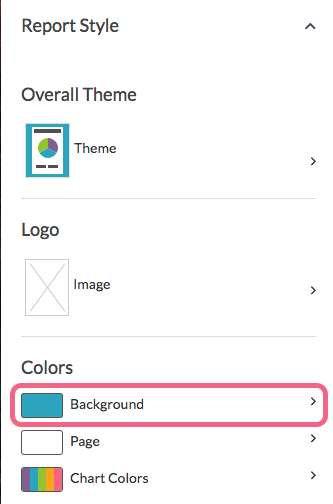
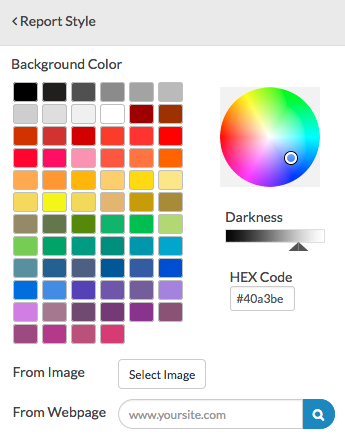
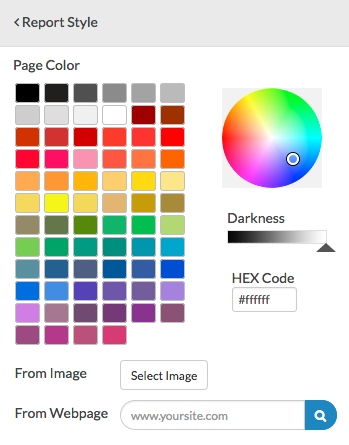
Click the Background option in the left-hand panel of your Standard Report to change the background color of the report. You can choose from our quick colors, use the color wheel, or enter a specific HEX Code if you have it handy.
In addition, SurveyGizmo can grab colors from either an uploaded image or a website. Use the From Image or From Webpage options to provide a color source for the background of the report.
Page
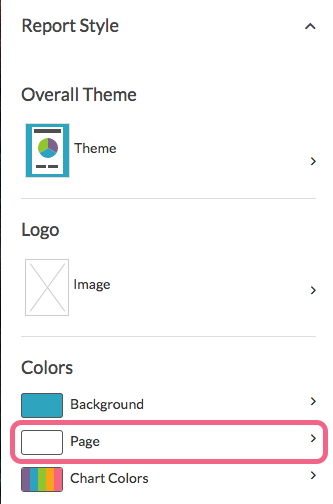
Click the Page option in the left-hand panel of your Standard Report to change the page color. You can choose from our quick colors, use the color wheel, or enter a specific HEX Code if you have it handy.
In addition, SurveyGizmo can grab colors from either an uploaded image or a website. Use the From Image or From Webpage options to provide a color source for the report page.
Page Width
You can adjust the page width via the Page Width option within Report Style > Layout section. The default page width is set to 80%; you can use the slider to adjust or type a specific percentage or pixel width into the available field.
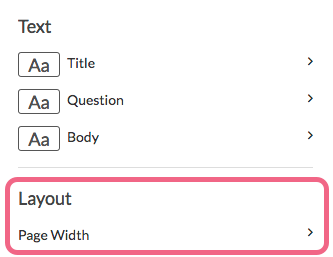
Chart Colors
Click Chart Colors in the left-hand panel of your Standard Report to get started customizing the colors that are used in the charts throughout the report.
Pre-built Color Sets
Under Pre-built Color Sets, there are color palettes galore. Be sure to scroll down to see all of the options. You can select a quick color palette that you like and then go to the Chart Colors section to further customize by adding, removing or adjusting the existing colors in that palette.
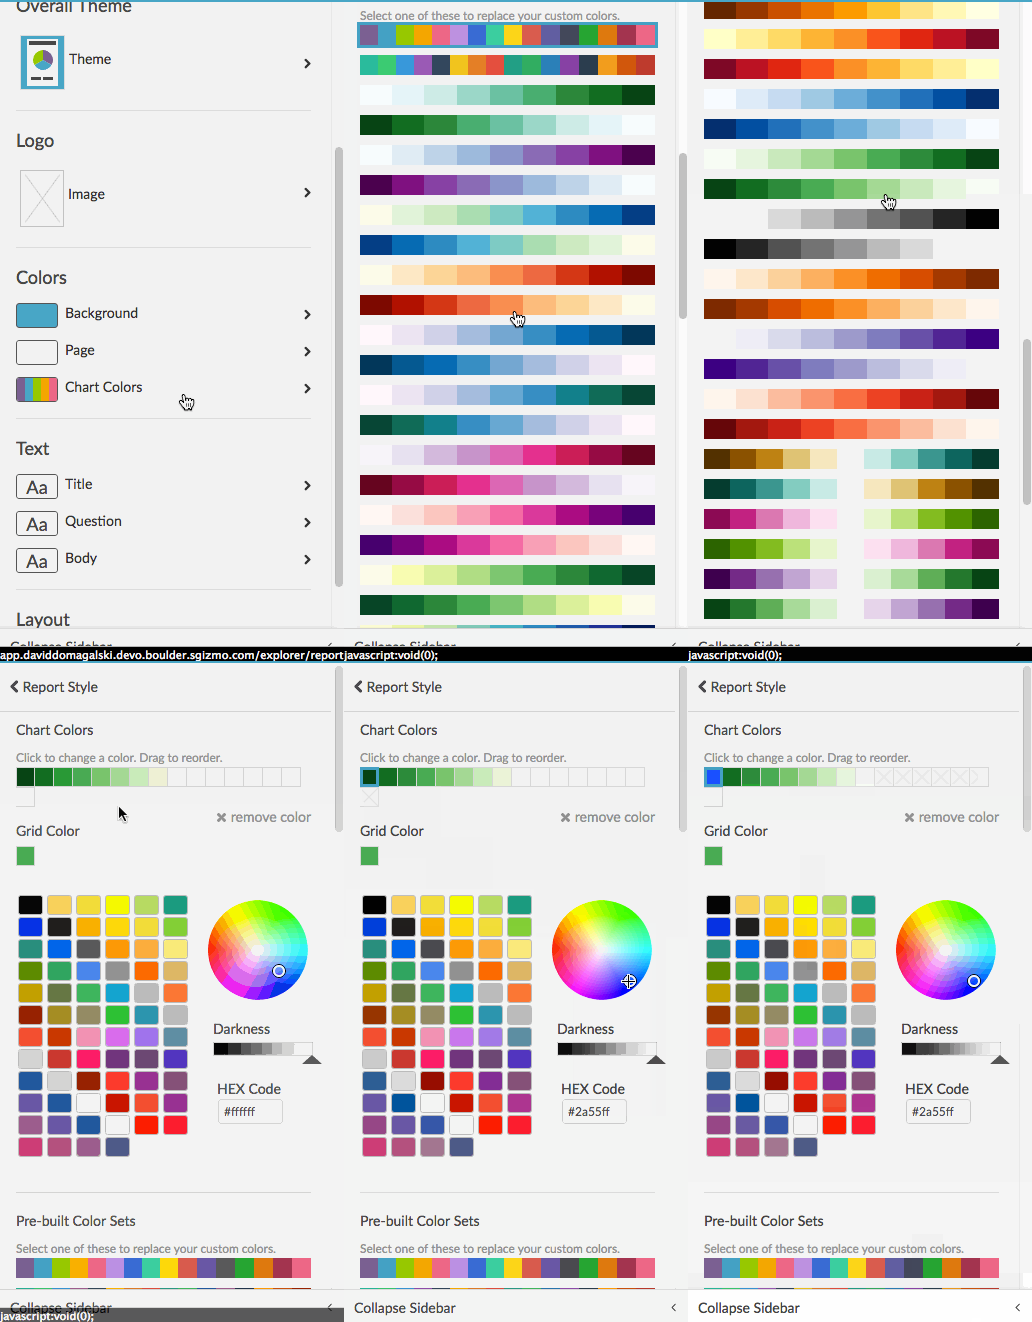
Chart Colors
Under Chart Colors you can customize to your heart's content.
Remove a color
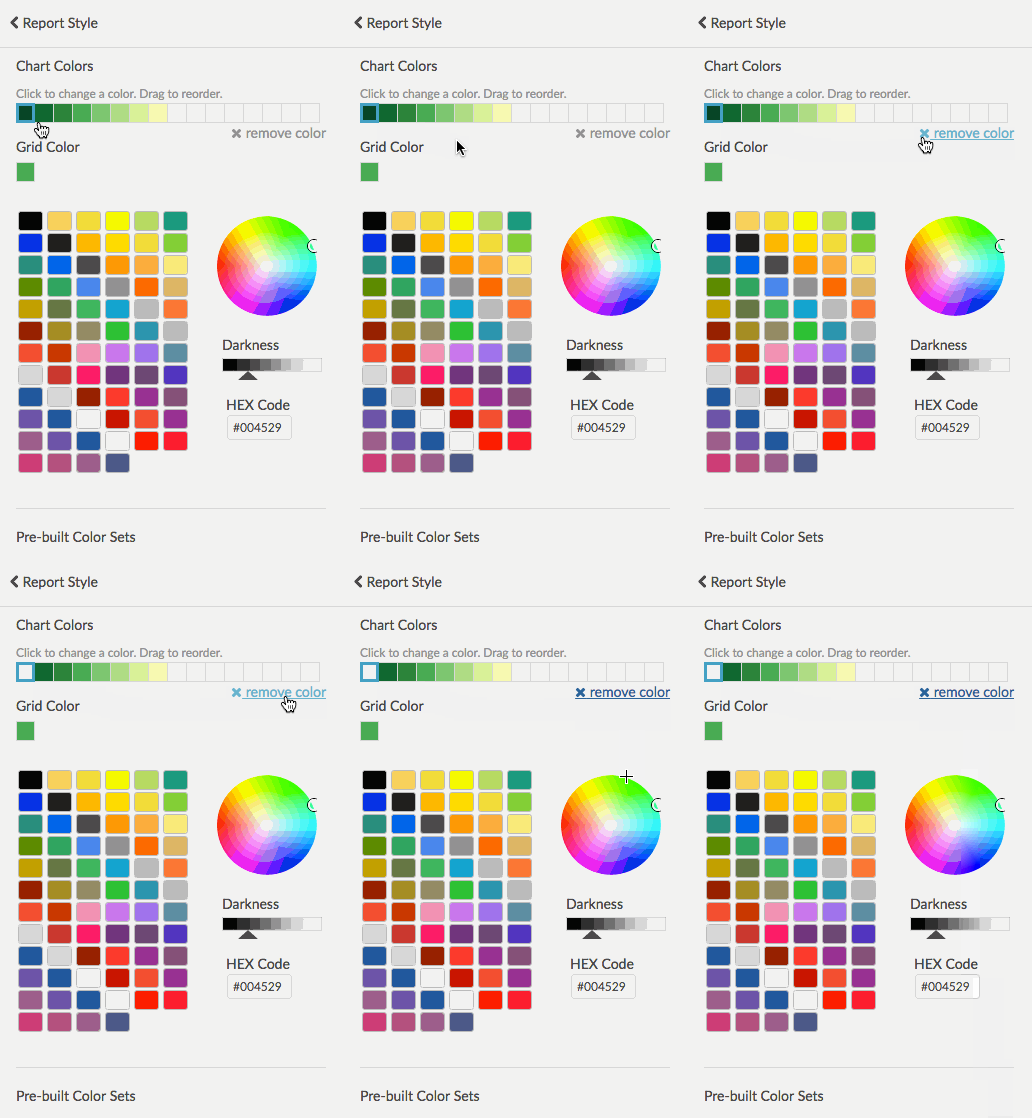
If you wish to remove a color from being used in any of your charts, select it and click the x remove color link.
Add a color
To add a color select an empty cell in your current color list and then choose from our quick colors, use the color wheel, or enter a specific HEX Code if you have it handy.
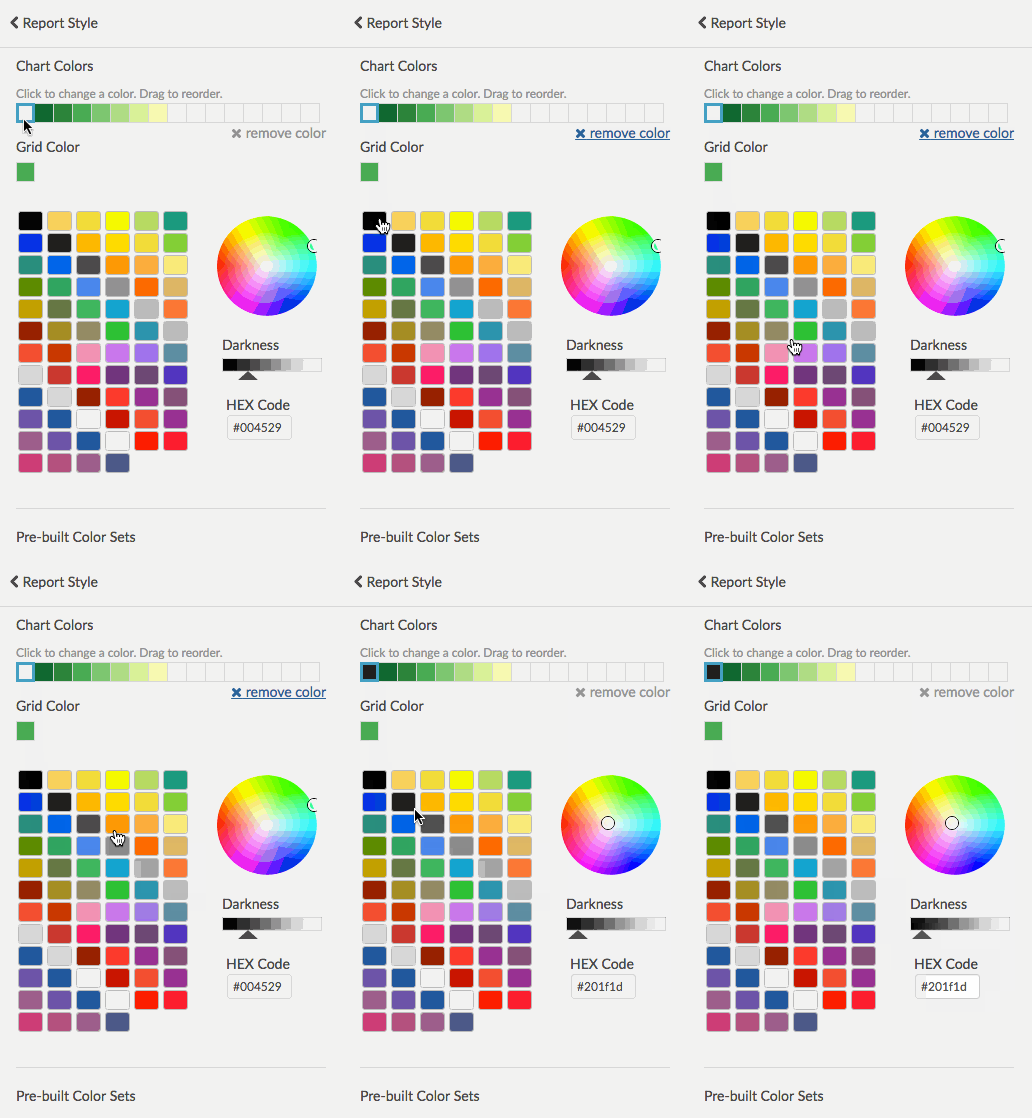
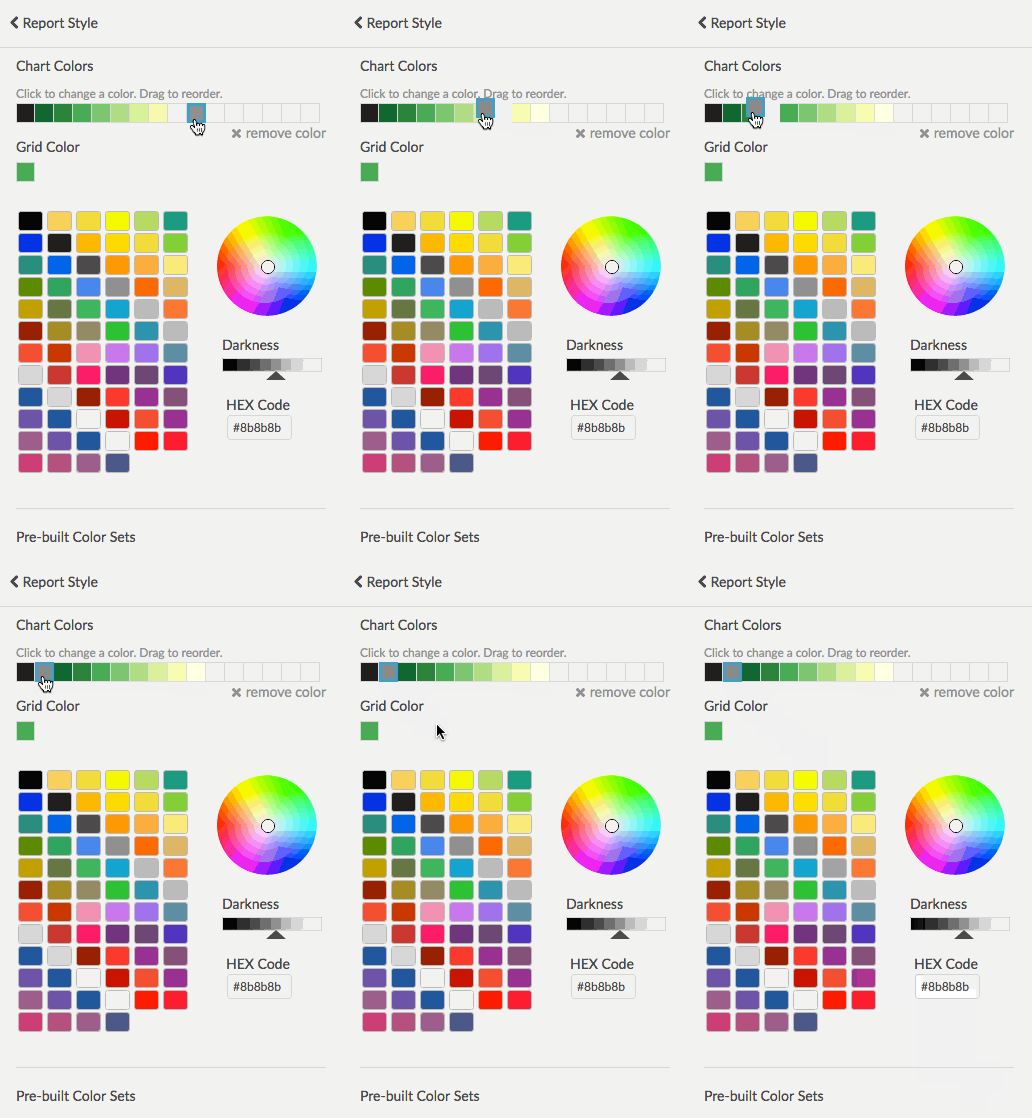
Reorder your colors
Colors will be used in your charts in the order they are listed. If you wish to reorder your colors, click, hold and drag colors to the desired location.
Text
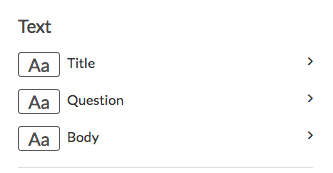
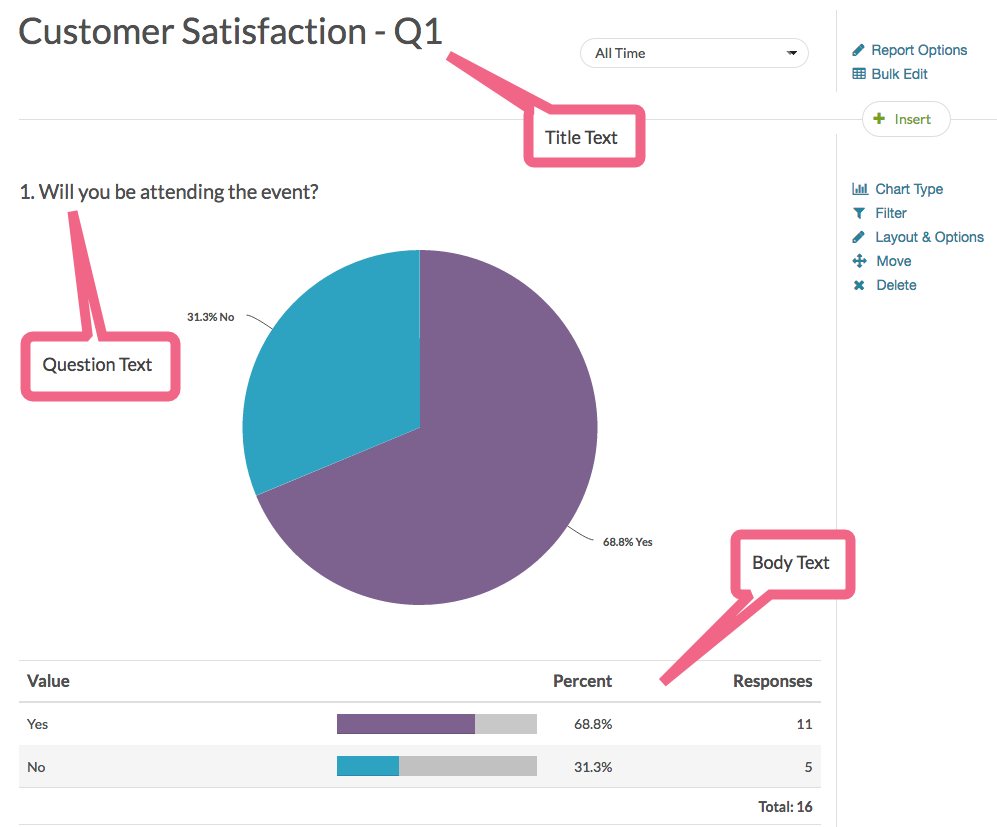
Under the Text options in the left-hand panel of your Standard Report, you can customize the font, font size, font weight, and color of your Title Text, Question Text, and Body Text.
Custom CSS
Finally, if you know your CSS you can add your own custom styles to further customize the report look & feel, under Report Options > Custom CSS.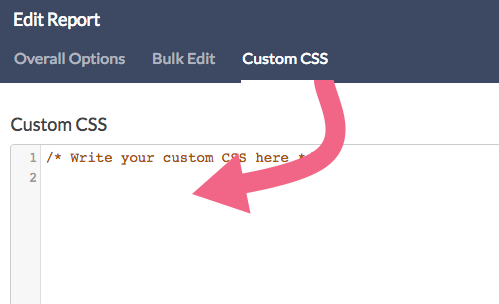
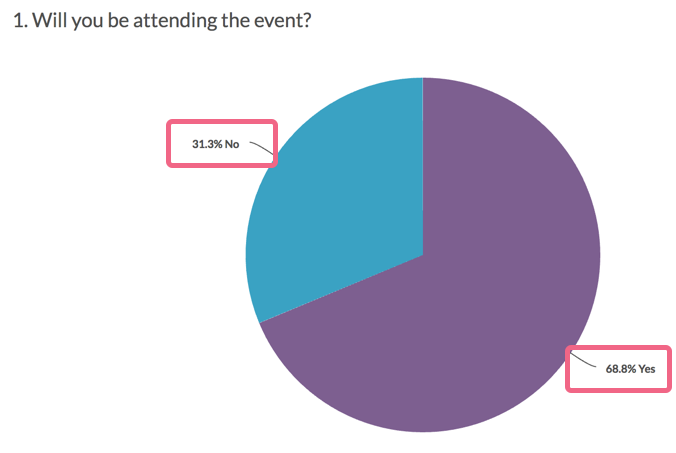
For example, to remove the data labels associated with Standard Report Pie Charts (pictured below), use the following code:
.highcharts-data-label{
display:none;
}
.highcharts-data-label-connector{
display:none;
}
Save a Theme to Your Library
Once you get your report looking just right, you can save the theme for re-use across other projects.
- Go to Report Style > Theme > Your Theme Library
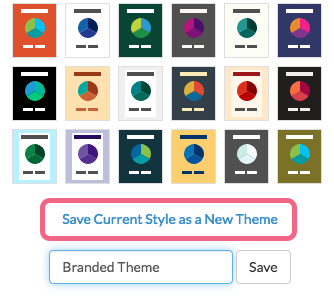
- Click the Save Current Style as a New Theme option at the bottom of the Pre-Built Themes.
- Give your theme a name and click Save. Now your theme is saved for use in future reports!
Applying a Saved Theme to Your Standard Report
Once you have a saved theme you'll likely want to apply this theme to another Standard Report. To do so go to Report Style > Theme > Your Theme Library and select the Theme you wish to apply.

— Mike.cordeiro on 05/11/2020
@Michael: Thank you for reaching out to SurveyGizmo Learning and Development!
At this time SurveyGizmo does not have the ability to change the colors specifically by word in word clouds. With this, we do have the ability to change what colors are in the word cloud and charts as a whole, but to change on a per word basis is not possible out of the box. This may be possible with custom scripting in the report if you have access to a programmer on your team.
I hope this helps!
Mike
Technical Writer
SurveyGizmo Learning and Development
— OPCC on 05/11/2020
Can I change certain word colours in word clouds that are produced in a standard report ?
Admin
— Bri Hillmer on 02/11/2019
@Nick.freiling: You can choose to display a reporting value rather than the answer option text if you wish. Here is a tutorial with more info:
https://help.surveygizmo.com/help/reporting-values#reporting-values-in-reports-and-exports
I hope this helps!
Bri Hillmer
Documentation Coordinator
SurveyGizmo Customer Experience Team
— Nick.freiling on 02/11/2019
Is it possible to change the answer option text in a report, but not in the survey instrument itself?
Admin
— Dave Domagalski on 04/09/2018
@JJayne: Thank you for your question!
I'm afraid that the PDF that can be attached as part of the Send Email action cannot be modified or styled.
While you can download a PDF of a report, this PDF cannot be merged into a Send Email Action as an attachment. An alternative would be to include the report link in the body of the email.
SurveyGizmo also offers Custom Scripting capabilities that allow you to build a custom PDF that can then be emailed. The scripting resources can be found here:
https://script.surveygizmo.com/help/
Last, if you don't have development resources on your team and want to pursue this custom option, SurveyGizmo's Programming Services team is a great option for this:
https://www.surveygizmo.com/programming-services/
I hope this helps clarify!
David
Documentation Specialist
SurveyGizmo Customer Experience
— Alice on 04/08/2018
Hi!
I would like to be able to modify/style the PDF that can be sent to participants at the end of a quiz as an attachment to an email (action). At the moment it seems that there is a standard PDF report that is generated which I can't modify.
I would prefer to be able to create one in the reports area and then select this as a merge field.
Is this possible?
Admin
— Bri Hillmer on 12/04/2017
@Miquel: The Custom CSS option in reports is only available on our new license-based plans I'm sorry to say. Let us know if you need help upgrading!
Bri Hillmer
Documentation Coordinator
SurveyGizmo Customer Experience Team
— Miquel on 12/04/2017
Hi, can we add some customized CSS in a report? We have Legacy Plan licence
Admin
— Bri Hillmer on 04/10/2017
@Avishek: You can indeed switch to different chart types! As far as converting a table to a series of pie or bar charts you would need to report on the grid rows separately as covered in this tutorial:
https://help.surveygizmo.com/help/report-on-grid-rows-seperately
I hope this helps!
Bri
Documentation Coordinator
SurveyGizmo Customer Experience Team
— Avishek on 04/09/2017
Hi Bri, is there a way to change the chart type - from bar to pie? Or, to change a table into a pie?
Admin
— Bri Hillmer on 10/05/2016
@Sandy: It sounds like perhaps you are looking to add Text/Instruction elements to the Standard Report. At this time text from Text/Instructions will need to be manually added using the Text option in the hover tool. Here is a tutorial with more info:
https://help.surveygizmo.com/help/reporting-element-display-options#text
I hope this helps!
Bri
Documentation Coordinator/Survey Sorceress
SurveyGizmo Customer Experience Team
— Sandy on 10/05/2016
How can I include text/instructions in a standard report?
Admin
— Bri Hillmer on 08/15/2016
@Meng: We do not currently allow for appended CSS in the Standard Report. Let us know what you are looking to do and we can see about making this available!
Bri
Documentation Coordinator/Survey Sorceress
SurveyGizmo Customer Support
— Meng on 08/12/2016
Hello, do we have the ability to customize css in the new standard reports?