The Power BI Action is available as an Add-On to SurveyGizmo accounts. Interested in purchasing this Action? Contact us for more information.
The Power BI Action allows users to push data from SurveyGizmo to utilize several data analytics features in the tool. Microsoft Power BI allows one to make decisions with confidence and leverage data as soon as it is available, offering several methods to visualize information. Use the Power BI Action to push data seamlessly into Power BI and utilize advanced reporting analysis.
There are 3 ways to push SurveyGizmo responses into Power Bi:
- Use the Power BI Action in SurveyGizmo to live stream data.
- Export previously collected responses from SurveyGizmo as a CSV and import the CSV into Power BI
- Utilize a Data Warehouse to pass responses through to connect historical and live streaming data in Power BI.
Live Streaming data into Power BI
Setup
To move live streaming data into Power BI, ensure one is using the web-based application of Power BI as opposed to the desktop version
- Mapping data begins with creating a dataset to capture information pushed from SurveyGizmo to Power BI. Start by logging into the dedicated Power BI account. Select Create in the top right of the screen and choose Streaming Dataset > API > Next:
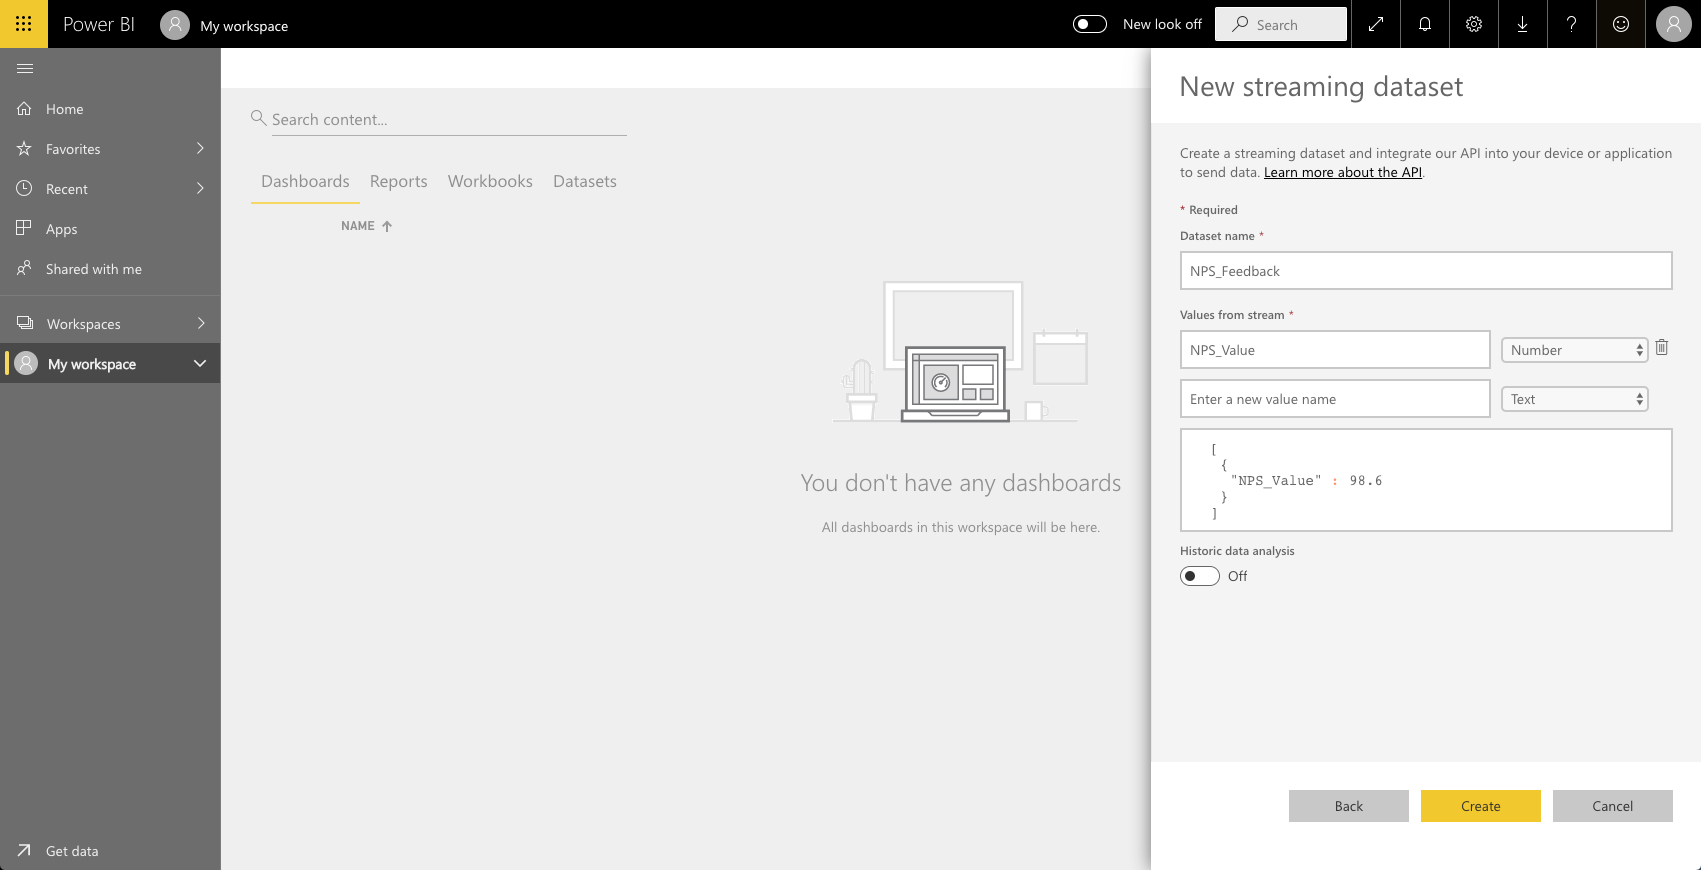
- Provide a name for the dataset and the values from the stream. These reflect what exists in the survey where the action will be created. If the question being added is one with numerical values, change the dropdown to read number. To aggregate live responses that will be saved long term in Power BI, turn Historical Data Analysis on. Select Create:
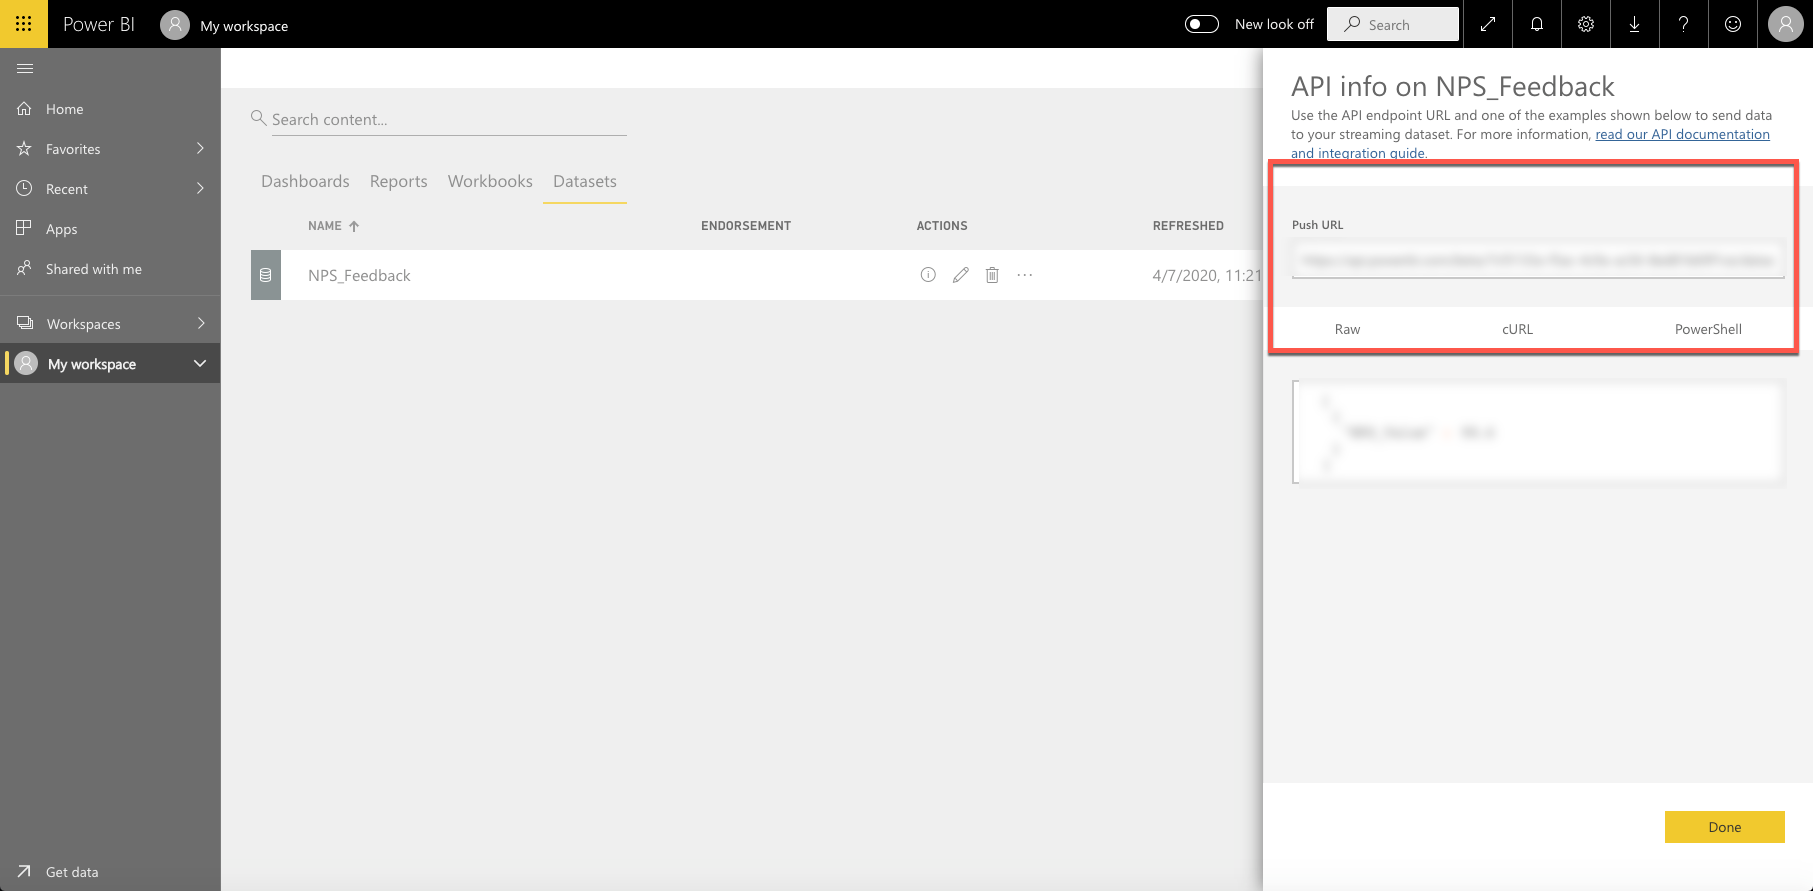
- Choose Next. Copy the Push URL and save it for later use. This is referenced later in the platform to send data to Power BI. Click Done:
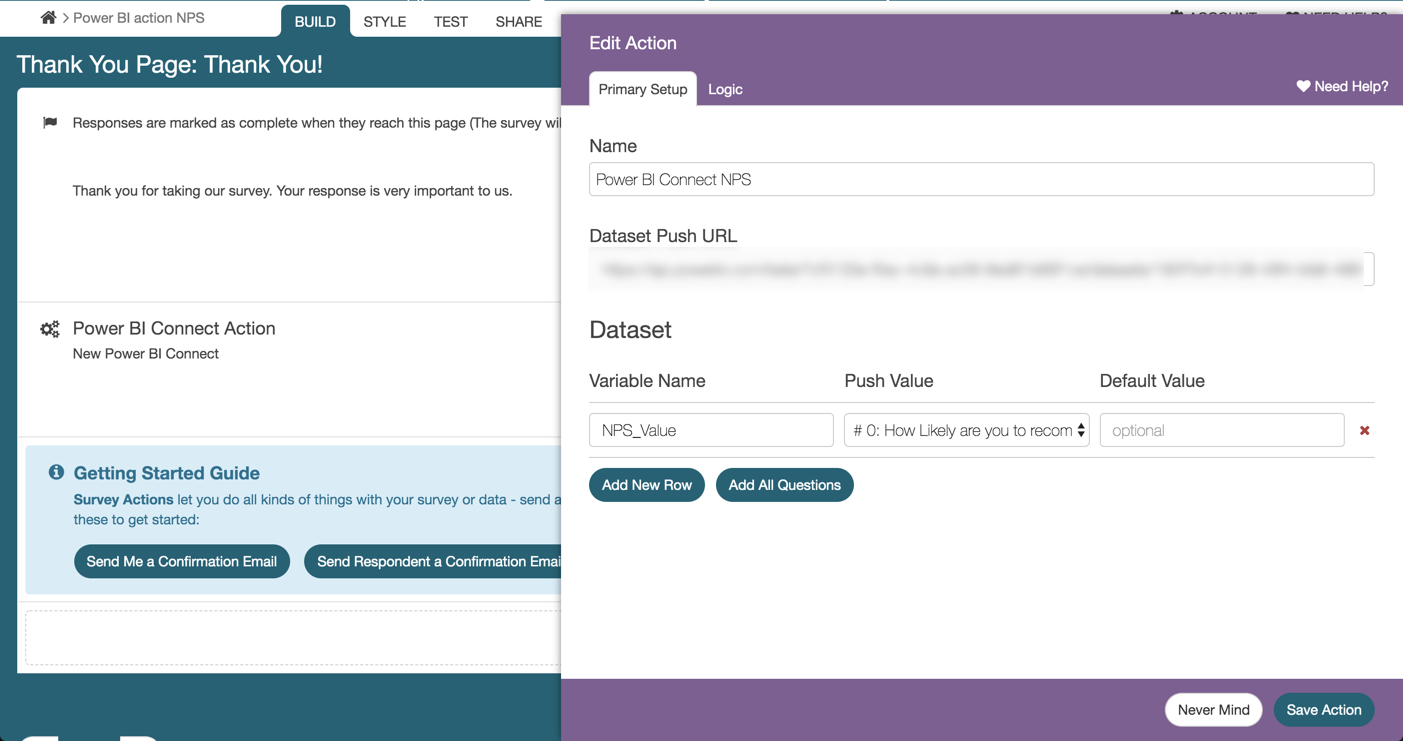
- Navigate back to SurveyGizmo. Add the Power BI Connect Action to the page after the questions one would like to push to Power BI by clicking Action.
- Paste the Push URL from Power BI in the Dataset Push URL text box. Add each question one would like to send to Power BI. Provide the Values to Stream Name that was created earlier in step 2 in Power BI in the Variable Name text box as seen below:
- Navigate back to Power BI. Create a dashboard to store the data from SurveyGizmo using the Create icon in the top right.
- Name the dashboard and click Create. Choose the Add Title option in the top right of Power BI.
- Select Custom Streaming Data to add a Dataset. Click Next. Choose the dataset that was created as seen below. This references the survey dataset being pushed to Power BI:
- Select Next to create a custom streaming data tile:
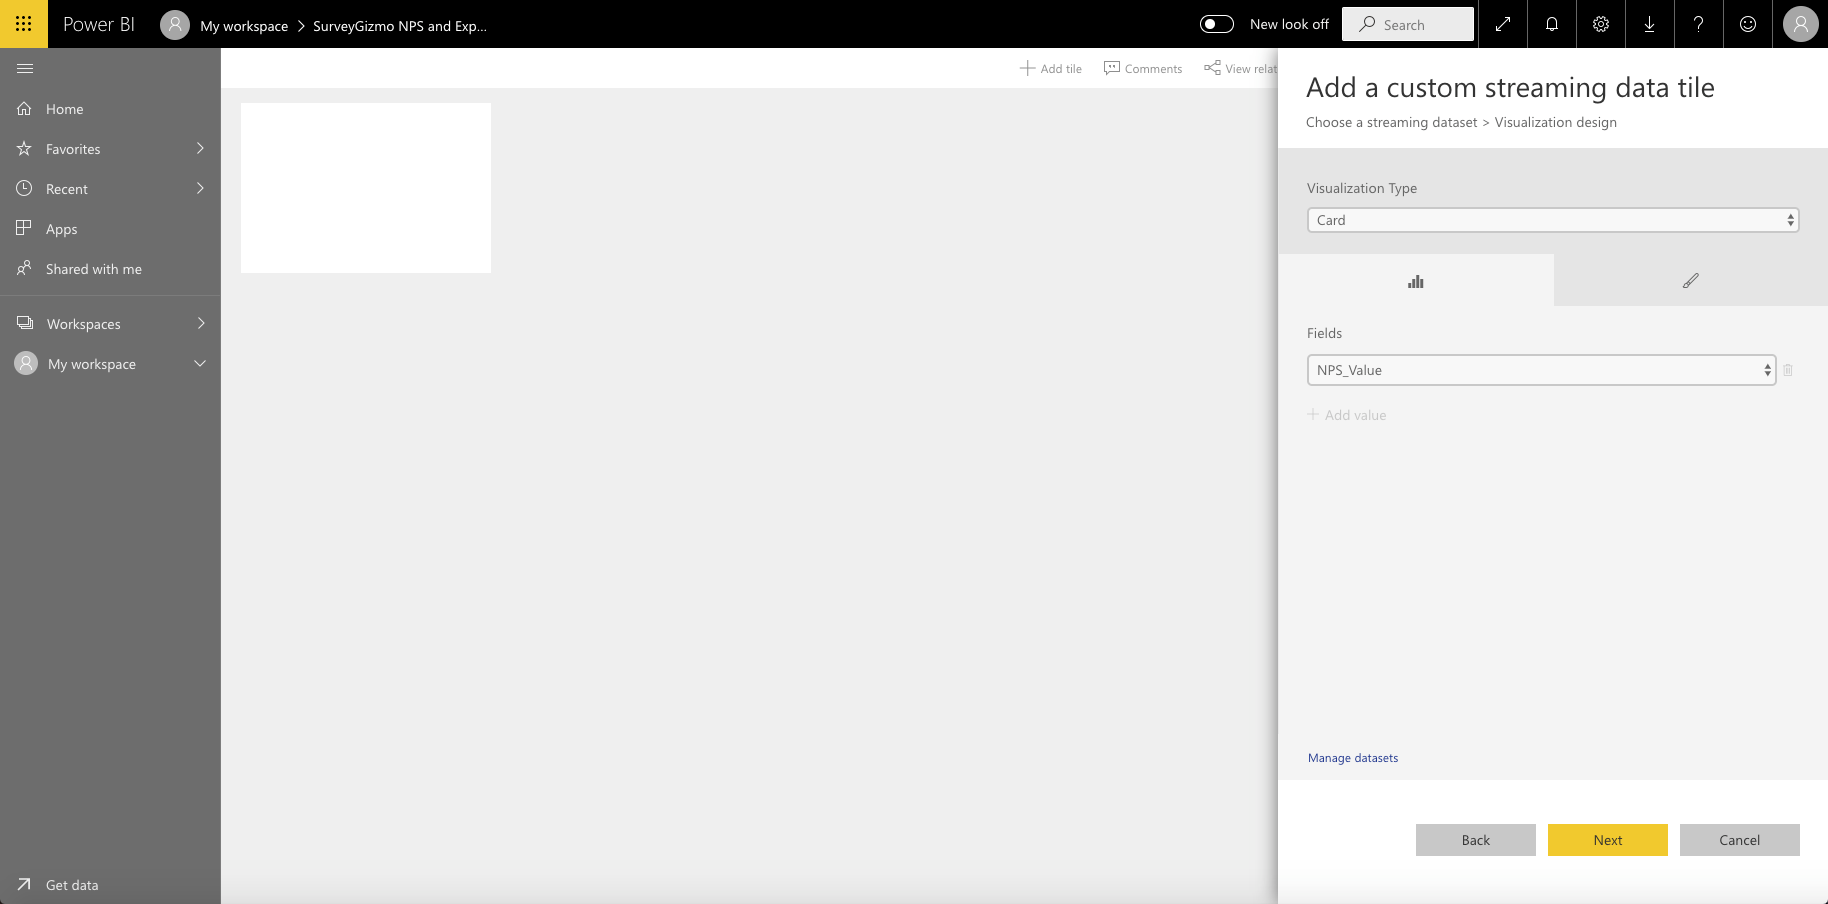
- Choose the preferred Visualization Type for the data being pushed into Power BI from the dropdown menu. In this example the Card visualization is used to view a singular number from what is populated from SurveyGizmo.For more insight on the Visualization types available, visit Power BI documentation for additional information.
- Choose the value to be pushed into the card visualization via the fields dropdown. Navigate to the Tile Details tab to name the tile as well. Make the preferred changes and select Apply:
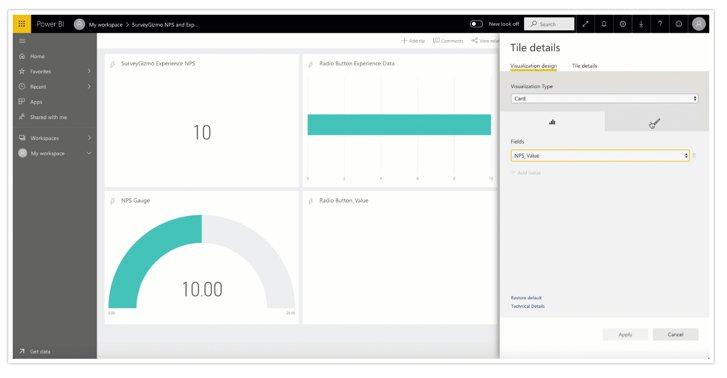
- Head back into SurveyGizmo and to the Share tab. Populate a survey response via the Primary Link to see data is being passed. The number will populate in the card as seen in the top left card. The other visualizations can be used here to make sense of data.


For more information on how to leverage Power BI and their analytics, check out Power BI Documentation.
Uploading Previously Recorded Responses from SurveyGizmo into Power BI using a CSV
Power BI allows for CSV files to be uploaded into the platform. This provides SurveyGizmo users the ability to utilize Power BI for previously collected surveys and responses!
Setup
- Log into SurveyGizmo. Select the survey that contains previously collected responses. Choose Results > Exports > CSV/Excel. Select each field Display Option to be included in the CSV File. Select Create Report:
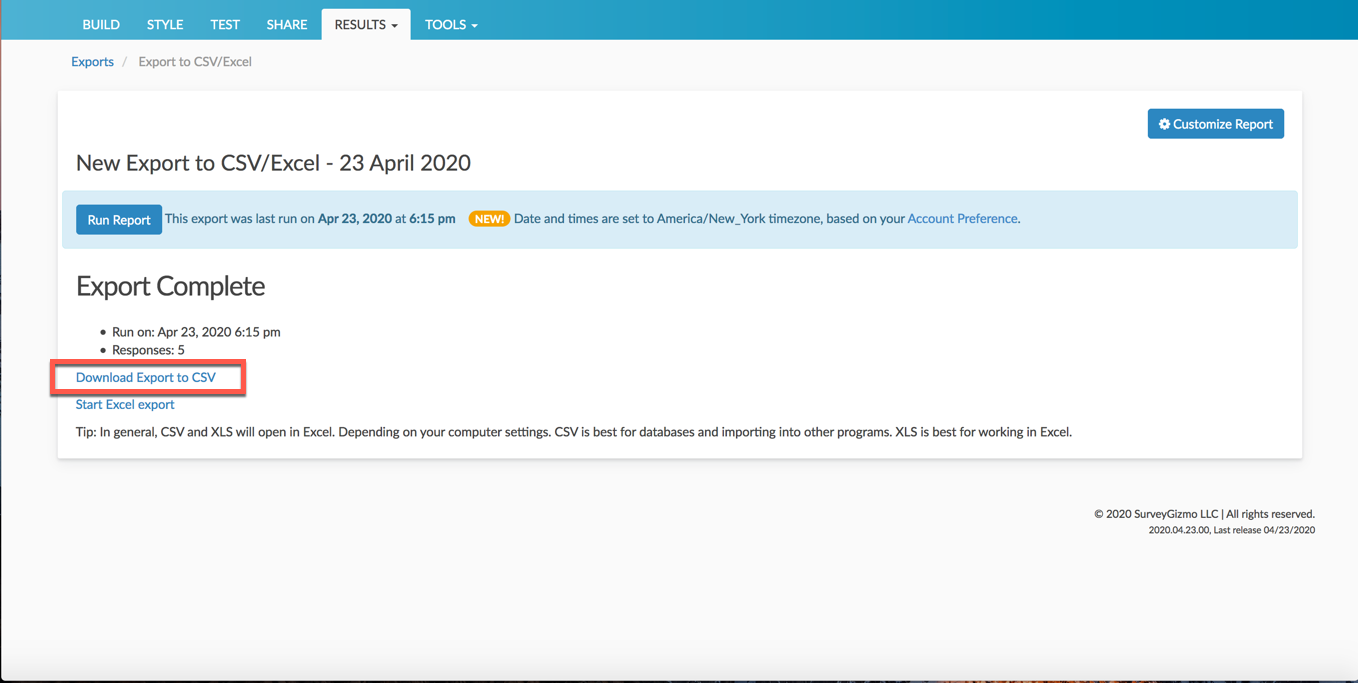
- This displays the Edit Report Settings window. Select what questions and data to include in the file. After selecting/deselecting the available fields for the export, click Save. On the Export complete page, select Download Export to CSV:
- Once the file is downloaded and accessible on the device of choice, Navigate into Power BI.
- Within power BI, select Get Data from the navigation menu. Select Get from the Files tile. Choose the source of the file for upload:
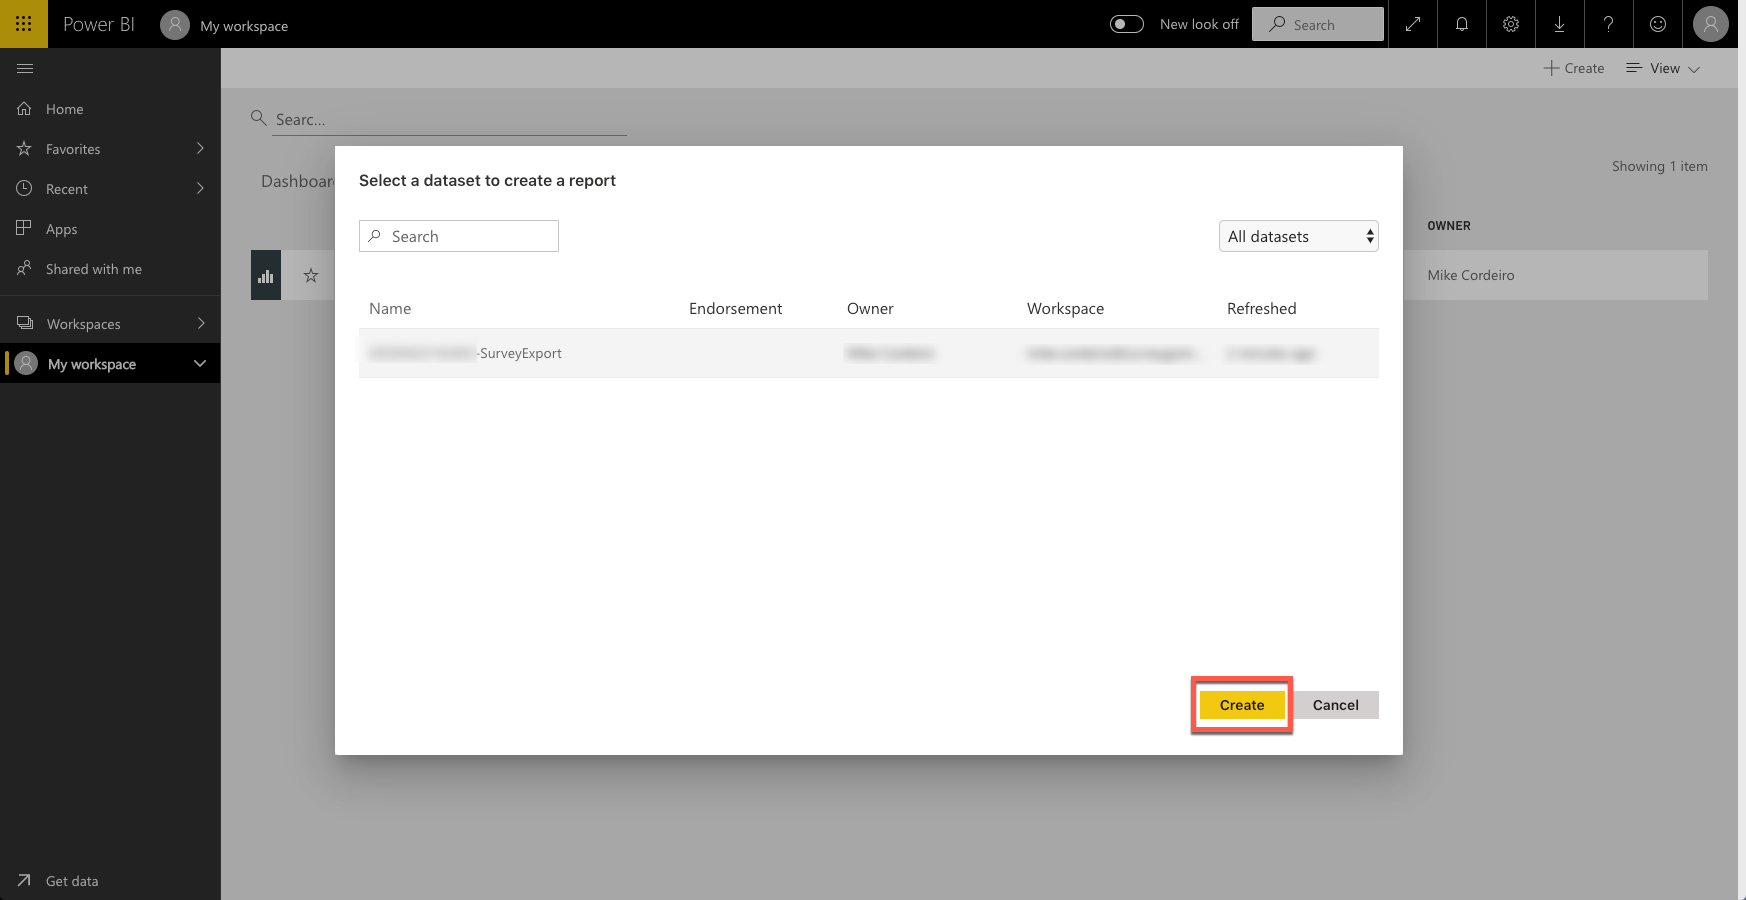
- Once pulled into Power BI, Select Create > Report. Choose a dataset to create the report. The file uploaded into Power BI is listed here. Click the dataset and select Create:
- This brings one to the reports page where users create custom visualizations of their data. First select the visualization of choice from the menu on the right. The Fields section represents the columns that exist in the CSV file.
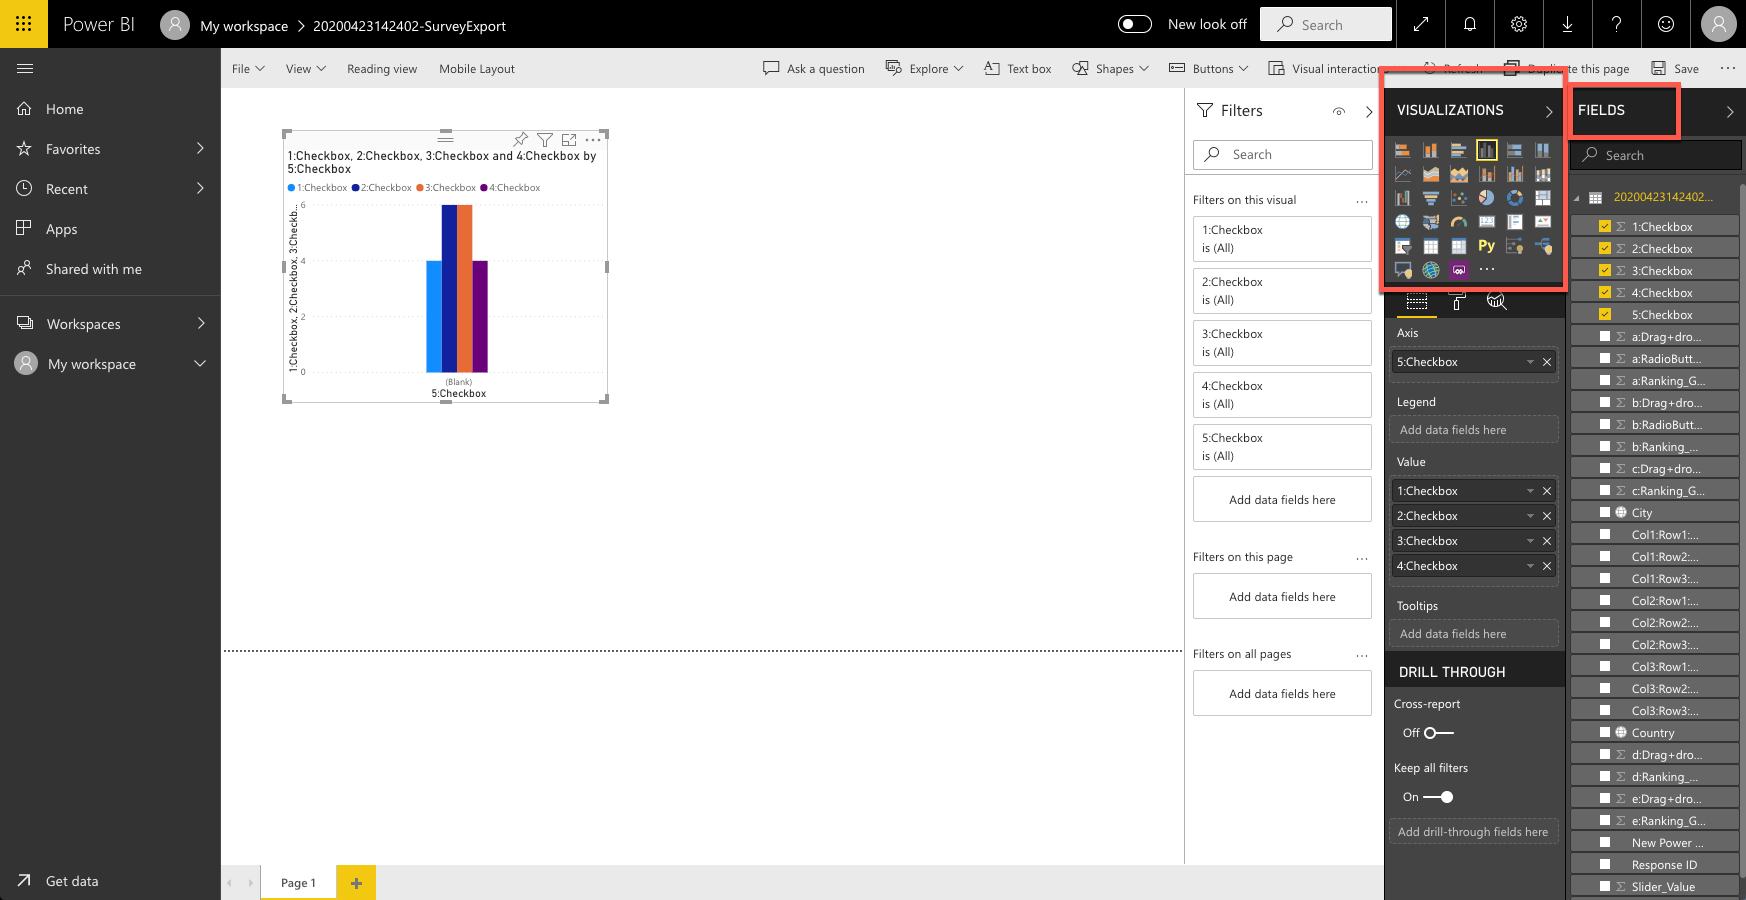
- When a visualization is selected, a blank chart will display in the section below the menu items. Simply drag each column from the fields into each blank chart to start to build visualizations.
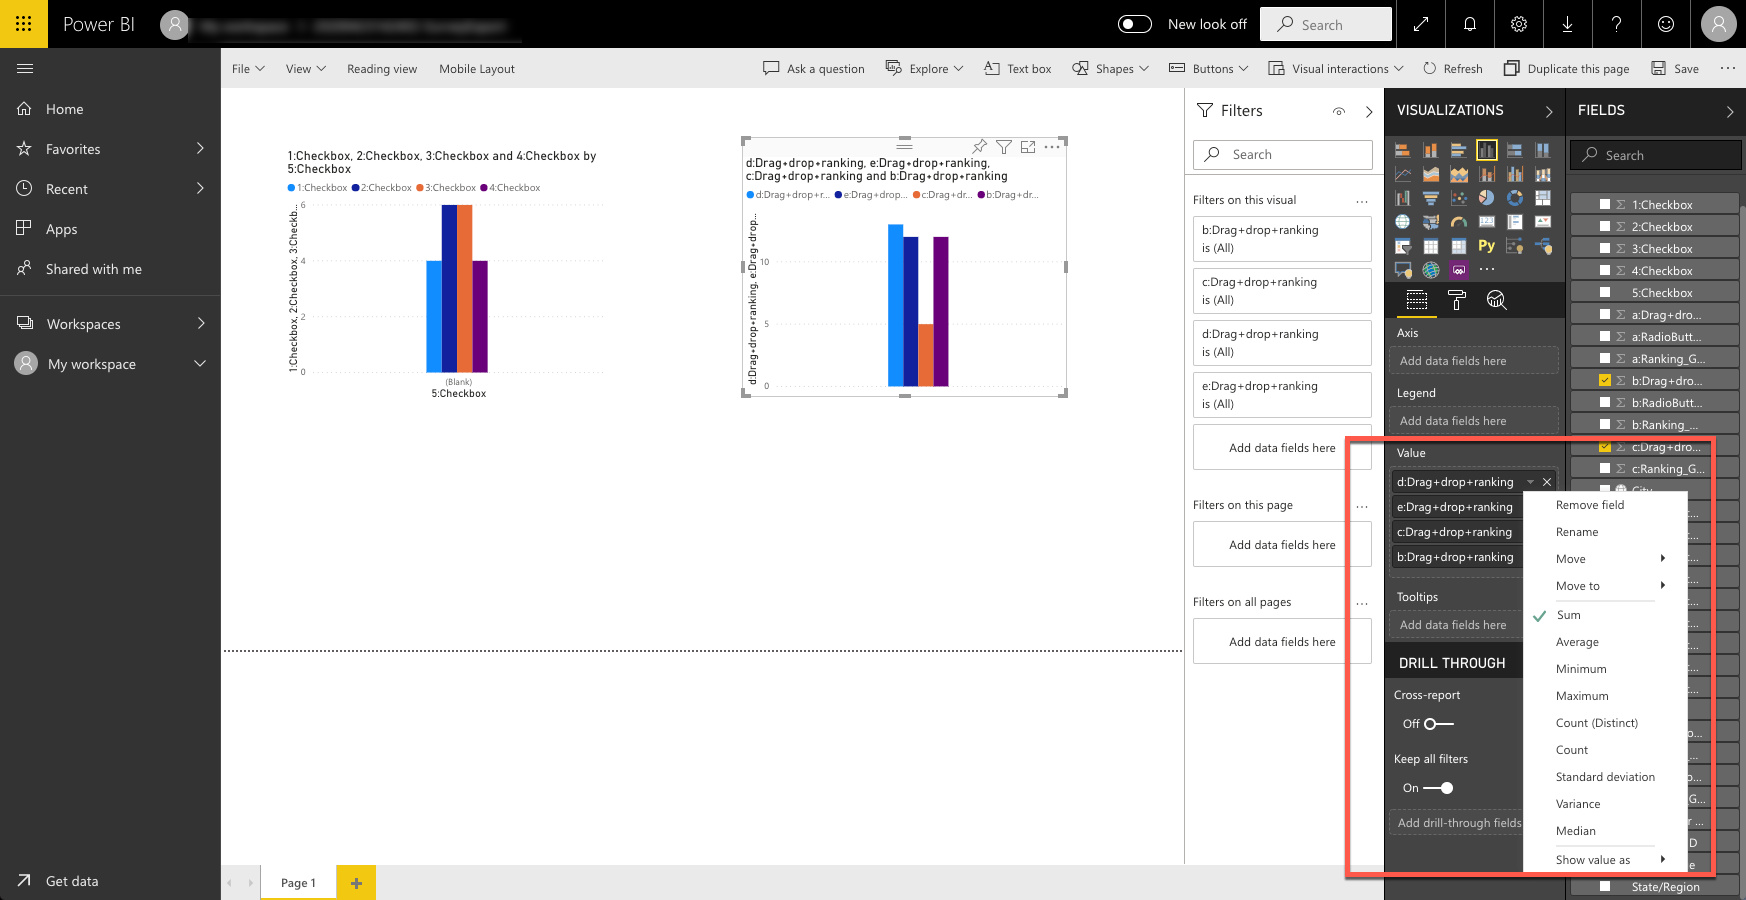
- Once fields exist in a visualization, change the value settings based on user needs. One can rename each value in the chart as well as have charts display the sum, average, standard deviation, variance, and more:


For more information on Visualizations in Power BI Reports, click here.
Limitations
- Re-firing the Power BI Action does not update or change alterations in a response that was previously collected.
- Desktop Application of Power BI cannot be used to stream live data.
- Historical data imports cannot be combined with live streaming datasets.
- Power BI REST API Limitations
Compatible Question Types
- Radio Button
- Net Promoter Score
- Textbox
- Checkbox
- Radio Button Grid (Rows)
- Slider
- Checkbox Grid as visualization
- Drag and Drop
- Hidden Values
Additional Resources
- Get started building with Power BI
- Analyze data with Power BI
- Use visuals in Power BI