- Check it out in an example survey!
- Add a survey with this question to your account!
A Radio Button Grid allows respondents to select an answer option (column) for each row in a grid. If you are looking to allow only one response per column, check out our Ranking Grid question type.
When To Use It
Use a Radio Button Grid to group a series of radio button questions together that share the same answer options.
Radio Button Grid questions are great to use in place of using a series of Rating (Likert Scale) questions when you need to report on the questions together. The grid averages feature will allow you to do just this!
Adding a Not Applicable Option
Have a 'not applicable' option in your Radio Button Grid? Set up the N/A special setting so you can easily remove these responses in reporting.
To do so, click the pencil icon to the right of your column header and select the Not applicable option from the Special Settings dropdown.

Layout Customizations
On the Layout tab, you can adjust the overall question width, the width of the row-header column and/or all other columns.
Note: By default, grid questions will have an overall question width of 100% and a row-label width of 40% to stretch the question across the entire survey page. You can change these widths as needed.

While each width is set as a percentage by default, you can toggle this to a pixel value if needed. Reference the below image to determine what each width will affect.

On the Layout tab, you can also take advantage of the option to Repeat Column Headers which is great for large grids.

Survey Taking
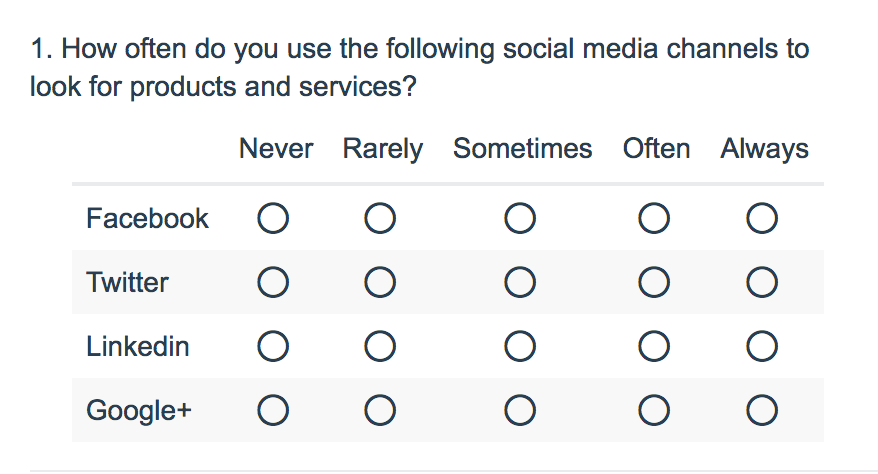
On a desktop and most laptops, the Radio Button Grid question type looks like so.
When optimized for mobile devices the Radio Button Grid question type displays each row one at a time. It will also have larger targets as mobile respondents will be using their finger to select answers.
You can turn off the one-at-a-time interaction if you wish.

Reporting
Radio Button Grids report as a Grid by default. Each row and column combination will have a count and row percent. The total Responses for each row will also display in the table by default.

Count
- This is the count of responses for that cell.
- When talking about this statistic in plain language we can say, "102 respondents said they Never use Facebook to look for products and services."
Responses
- This displays the count of responses for that row.
- This statistic can be turned on/off using the Row Total Responses option under Layout & Options > Grid Options.
- The percentage that displays in the Responses column is also controlled by the Row Total Percents option under Layout & Options > Grid Options.
- When talking about these statistics in plain language we can say, "312 respondents, or 94.5% of respondents who answered this the overall question, provided an answer as to how often they use Facebook to look for products and services."
Row %
- This is the percentage for the cell with the row total as the denominator. So, for example, the 32.7% that displays in the first cell is calculated by dividing 102 by 312.
- When talking about this statistic in plain language we can say, "32.7% of respondents that provided an answer as to how often they use Facebook to look for products and services said they Never use Facebook to look for products and services."
- This statistic can be turned on/off using the Row Percents option under Layout & Options > Grid Options.
See additional available statistics
The following additional statistics are available for reporting in Radio Button Grids: Row Total Percents, Row Average, Column Total and Column Average Percents. In the below example report all available statistics are turned on. Let's cover how each of these is calculated.
Column %
- This is the percentage for the cell with the column total as the denominator. So, for example, the 38.8% that displays in the first cell is calculated by dividing 102 by 263.
- When talking about this statistic in plain language we can say, "38.8% of all Never responses were in response to the use of Facebook to look for products and services."
- This statistic can be turned on/off using the Column Percents option under Layout & Options > Grid Options.
Column Avg. %
- This is the percentage of responses of all responses for all rows that selected that column. So, for example, the 23.5% that displays in the Never column is the count for that column divided by the sum of all responses (1117). This statistic is particularly handy for scanning to see what was the most popular response for all responses to all rows.
- When talking about this statistic in plain language we can say, "23.5% of all responses to the question overall were Never responses."
- This statistic is also controlled by the Column Percents option.
Average
- This is the average score for the row. This statistic requires numeric reporting values. The average is calculated by multiplying the count of the cell by its numeric reporting value. Summing the product from all the cells and dividing by the total responses for the row. So for our example questions, the columns Never - Always have reporting values 1-5 respectively. So, for example, in the Facebook row of the table the average of 2.5 = ((102 x 1) +(72 x 2) + (57 x 3) + (34 x 4) + (47 x 5))/312.
*If you are using a Not Applicable answer option in your survey, please note the below information:
- If your question contains a Not Applicable answer option/column and you have applied a numeric Reporting Value, the NA option will be included when calculating the average.
- If a non-numeric reporting value has been defined, the NA option will not be included when calculating the average.
- If you choose to not show the Not Applicable answer option in the Standard Report, the NA option will not be included when calculating the average.
- The average for all table rows in the lower right corner is the average of all rows together. If you are looking for traditional Likert scale reporting, switching from a series of Rating (Likert Scale) questions to a Radio Button Grid is a good idea, as this is the value you would want to use.
- If you are using a scale-type answer set in your columns, this is a great way to quickly scan your rows to get a sense for the highest or the lowest rated row overall.
- This statistic can be turned on/off using the Row Average option under Layout & Options > Grid Options.

Learn how to report on grid rows separately
In Standard Reports the rows of both Radio Button Grid and Checkbox Grid questions can be reported on separately as various chart types. Here are the steps to set this up:
Click the Insert button between any two report elements and select Question Chart from the dropdown menu. In the next dropdown menu look for your grid question. Instead of selecting the overall question title, select the first row of the grid, seen below, and click Add Question. Continue adding each row of the grid question.

This will display the rows of the table in chart format. Beautiful!

See additional compatible chart types
Within the Standard Report there are various chart types available for visualizing your data. The below grid shows which of the our chart types Radio Button Grid questions are compatible with.
| Chart Type (Aggregate) | Compatible | |
|---|---|---|
| Pie Chart | (Individual Rows*) | |
| Arc Chart | (Individual Rows*) | |
| Donut Chart | (Individual Rows*) | |
| Vertical Bar Chart | (Individual Rows*) | |
| Stacked Vertical Bar Chart |  | (Individual Rows*) |
| Horizontal Bar Chart |  | (Individual Rows*) |
| Stacked Horizontal Bar Chart |  | (Individual Rows*) |
| Spiderweb Chart | (Individual Rows*) | |
| Histogram | ||
| Line Chart | ||
| Spline Chart | ||
| Area Chart | ||
| Area Spline Chart | ||
| Scatter Plot | ||
| Word Cloud | ||
| Collapsed Response List | ||
| Grid | ||
| Diverging Stacked Bar Chart | ||
| NPS Chart | ||
| Contact Cards | ||
| DIY Grid/Cards | ||
| Table |
| Chart Type (Longitudinal) | Compatible | |
|---|---|---|
| Longitudinal Line Chart | (Individual Rows*) | |
| Longitudinal Area Chart | (Individual Rows*) | |
| Longitudinal Spline Chart | (Individual Rows*) | |
| Longitudinal Area Spline Chart | (Individual Rows*) | |
| Longitudinal Vertical Bar Chart | (Individual Rows*) | |
| Longitudinal Stacked Vertical Bar Chart | (Individual Rows*) | |
| Longitudinal Stacked Area Chart | (Individual Rows*) | |
| Longitudinal Stacked Spline Area Chart | (Individual Rows*) |
*See report on grid rows separately to learn how.
See what other report types are compatible
The below grid shows which of the report types Radio Button Grid questions are compatible with. If you plan to do some specific analysis within SurveyGizmo this report compatibility chart should help you choose the right question types.
| Report Type | Compatible |
|---|---|
| Standard | |
| Legacy Summary | |
| TURF | |
| Profile | |
| Crosstab | |
| Comparison | (Individual Rows Only) |
Exporting
The CSV/Excel Export will display a column for each row, displaying the reporting value of the column the respondent selected.

Best Practice Tip: Grid Questions on Mobile Devices
Grid questions are often used to allow your survey respondents to make comparisons. For example, in the below question, survey respondents are implicitly making a comparison across the various ice cream brands listed in the rows.
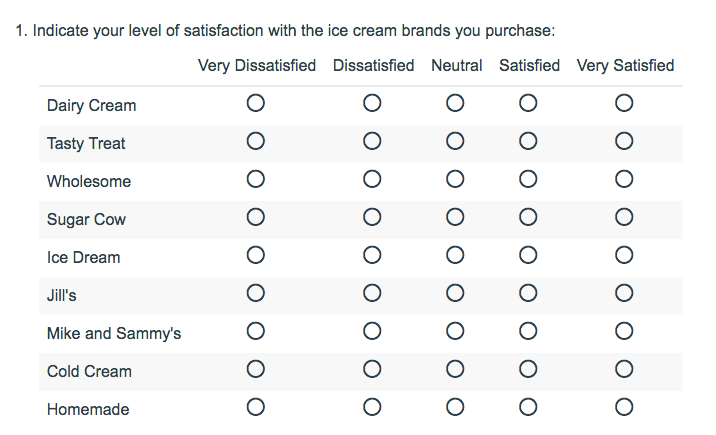
Because this is the most common and best use of grid question types it is important to note how grid question types display on mobile. Grid questions will be displayed one grid row per page. This will reduce horizontal scrolling trouble as well as problems survey respondents typically experience trying to select the correct option.
Admin
— Dave Domagalski on 06/18/2019
@Maximilian: Thank you for your question!
It sounds like the Quiz Score Action will be the best option for what you are looking to accomplish:
https://help.surveygizmo.com/help/create-a-quiz
Specifically, the Tally Quiz type is worth exploring.
In terms of directing participants to a certain page/question or URL based on the score, the below article should be a good starting point:
https://help.surveygizmo.com/help/setting-up-logic-based-on-a-quiz-score
I hope this gives you some options!
David
Technical Writer
SurveyGizmo Customer Experience
— Maximilian on 06/17/2019
In the radio grid question, I would like to assign a numeric value to each radio column (like 1 to the first, 2 to the second etc and then over all rows add up the score (so with 5 rows the minimum score one could get is 5x1 = 5. And then use that score to direct the participant to a certain page/question or URL. Can I do that in the radio grid?
Admin
— Dave Domagalski on 02/28/2019
@Nick: Thank you for your question!
I'm afraid that grid question rows cannot be sorted within a report.
One potential workaround would be to sort these to the desired order by editing the question on the Build tab (and rearranging the order). This should only be done at the end of data collection.
I hope this helps!
David
Technical Writer
SurveyGizmo Customer Experience
— CRE on 02/28/2019
Is there a way to sort the rows of a grid question in a report from greatest to least (by average or some other frequency like top-box frequency?)... similar to other question types that allow sorting from greatest to least in the standard report?
Admin
— Bri Hillmer on 09/14/2018
@Rscholl: The Standard Report does not currently support graphs based on averages. I'll make a note of this for discussion as a possible future improvement with the development team!
Bri Hillmer
Documentation Coordinator
SurveyGizmo Customer Experience Team
— Rosanne on 09/14/2018
Is there a way to make a bar graph of the means of each item in a grid question? (I am not looking for a bar graph of the responses to an individual item. Instead, I've assigned numerical values to an agreedisagree scale, found the mean of that scale for each item in the grid (by checking "statistics"), and I wish to make one bar graph that includes each item's mean. Is this possible?)
Admin
— Bri Hillmer on 08/16/2018
@Jesper: You can change the font size of column headers using a little bit of CSS code. Copy and paste the code in the Custom CSS tab of the report:
https://help.surveygizmo.com/help/report-styles#custom-css
#report-wrapper #report-body table.table thead tr th{
font-size: 1em !important;
}
I should mention that this will affect other tables in your report.
Hiding the row headers is not really possible I'm sorry to say.
Bri Hillmer
Documentation Coordinator
SurveyGizmo Customer Experience Team
— Jesper on 08/16/2018
Is it possible to change the font-size for the Column Headers without changing other fonts, when I set up the standard report for the question type Radio Button Grid.
Also is it possible to delete the row headers “Count” and “Row %” in the report layout. Thank in advance.
Admin
— Bri Hillmer on 01/13/2017
@Stefanie: What you describe would require scripting. We have a similar script documented:
https://script.surveygizmo.com/help/conditional-piping-from-radiogrid-to-checkbox
Alternatively this is the kind of customization that our programming services team does for a fee. You can get more information here:
https://www.surveygizmo.com/programming-services/
Bri
Documentation Coordinator
SurveyGizmo Customer Experience Team
— Stefanie on 01/12/2017
I'm trying to create a survey where I ask people to indicate how important each of a list of items is to them. I'm using the radio button grid to do this as the list is fairly long. Then, I want them to be presented with every item that they marked as 'very important' and have them rate again how important each of these is from 1-8. I don't seem to be able to do this with either piping or logic.
Admin
— Dave Domagalski on 12/20/2016
@Jesper: Thank you for your question!
When using a grid question as the source for logic conditions, only the grid rows are available for the logic conditions:
https://help.surveygizmo.com/help/setup-question-logic#show-hide-rows-of-a-grid-question
As such, for your scenario the best option is to create a logic condition for each row (separated by 'or' statements). A simplified version of this would look like this:
if 'row 1' is one of the following 'email'
or
if 'row 2' is one of the following 'email' and so on...
I hope this helps clarify!
David
Documentation Specialist/Survey Explorer
SurveyGizmo Customer Experience
— Jasper@bpact.xyz on 12/20/2016
What would be the best way to set up logic which makes a question show only to people who selected at least one of the options in a grid in certain column? For instance I'm asking in which way civilians receive their invoices (taxes, gas, electricity, water, ...). On paper, by e-mail, in a closed online system for invoices, ....
Later on I have a question that I want to ask only to the people who selected at least once they receive any invoice by e-mail.
Admin
— Bri Hillmer on 11/14/2016
@Nick: You can set up logic on the rows of a grid question, however, you can not base this logic off of the answer to a previous grid row I am sorry to say.
This is something that could be built out with JavaScript. Our Programming Services team does projects like this quite a bit. If you are interested in employing this team you can learn more here:
https://www.surveygizmo.com/programming-services/
Bri
Documentation Coordinator
SurveyGizmo Customer Experience Team
— Nick on 11/14/2016
Is there a way to include logic on a line of a grid so that certain questions are only displayed based on a previous answer in the same grid?
Admin
— Bri Hillmer on 10/07/2016
@Patrik.soderberg: I did a little testing and you can achieve this! What you'll want to do is show this question for all branches. Then you can set up logic on each row such that each row only displays for a specified branch.
Here is a screengrab of what I set up:
http://www.screencast.com/t/SYYivJzV
I hope this helps!
Bri
Documentation Coordinator/Survey Sorceress
SurveyGizmo Customer Experience Team
— Patrik.soderberg on 10/07/2016
Can branching be used for individual rows in a radio button grid (i.e., so that branch A only sees items 1-5, branch B items 1-4 and 6, branch C items 1-3 and 5-6 etc)
Admin
— Bri Hillmer on 09/21/2016
@Yehonatan: Both of these look and feel customizations would require pretty complex CSS. Unfortunately, it is beyond my skill level. We do have a programming services team that could accomplish nearly anything you're looking to do. You can learn more here:
https://www.surveygizmo.com/programming-services/
Bri
Documentation Coordinator/Survey Sorceress
SurveyGizmo Customer Experience Team
— Yehonatan on 09/21/2016
How can I create numbering for each row?
Admin
— Bri Hillmer on 08/03/2016
@Alex: We do not have the functionality you describe. If you have scripting chops you can probably get something going like this with a little JavaScript.
Bri
Documentation Coordinator/Survey Sorceress
SurveyGizmo Customer Support
— Alex on 08/03/2016
If I have 4 row headers (a, b, c, d) and 3 column headers (1, 2, N/A), can column "N/A" to be set limit to some rows? e.g. only row headers a, b, c can choose N/A, for row header d, N/A radio button is disabled