 Check it out in an example survey!
- Add a survey with this question to your account!
 Check it out in an
 The Image Heatmap question type allows your survey respondents to provide feedback on an image. Respondents can click anywhere on that image and select answer options you provide e.g. Like, Dislike.
You can also allow respondents to comment on their selections to provide additional context.
If you want similar functionality for a paragraph of text, check out our Text Highlighter question type.
When To Use It
The Image Heatmap is quite flexible and has a number of potential applications, for example:
- Use the Image Heatmap to gather feedback on a new webpage layout - ask respondents what section of the page they would click to access a specific part of your website to test how intuitive the design is.
- The Image Heatmap can help you perform research on a new product (concept testing). Ask your respondents to indicate what they like/dislike about your upcoming product.
Setup
- Click the Question link on the survey page where you would like to add the Image Heatmap question.
- Select Image Heatmap from the Question Type dropdown and enter your overall question text.
- Click on the image placeholder to add your image. If you have previously uploaded your image to your File Library, you can access it here. You can also upload your image directly to the question.
- Customize your Heatmap Options as well as the associated color. Choose the color by clicking on the color selector (highlighted below). This will be the color of the click marker visible to your respondents after they have selected an option to categorize their click.
If your Image Heatmap question contains only one option, the option will be automatically selected when the respondent clicks on your image.

Heatmap Options
The Image Heatmap question allows you to gather comments on heatmap selections (the comments can also be required). These options are available on the Layout tab.
Comments are enabled by default.

Validation Options
There are a couple validation settings that are unique to the Image Heatmap question.

If you have enabled comments on the question's Layout tab, you can limit the number of characters that can be entered by your respondents into the comment field. Once enabled, a comment box is available for each click on the image.
You can also limit the amount of clicks that a respondent can make on your image. Simply specify a number in the Max Highlights / Points Per Response field.
Both the Max Character Count and Max Points Per Response options are blank by default.
Customize Comments Instructions
If enabling comments for your Image Heatmap question, respondents will see the following default instructions:
"Select an option to provide feedback."

You can customize these instructions via Tools > Text & Translations. Click on the language version that you wish to edit and locate the specific Image Heatmap question that you want to customize. Click edit and update the text in the Comment Description field.
To translate the Save and Cancel button text, head to Tools > Text & Translations and navigate to the Save & Continue tab. Locate the Save and Cancel buttons in the list and make your customizations before saving.
Survey Taking
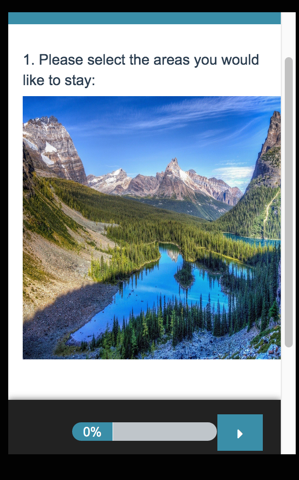
On a desktop and most laptops the Image Heatmap question looks like so.

When respondents can click on the image an overlay with the heatmap options and comment field. Clicking Save will capture the point on the image.
Mobile Interaction
The Image Heatmap mobile interaction will be the same as the desktop interaction. The respondent will make their selection by touching the image on their mobile device.
The image cannot be resized while taking the survey on a mobile device.
Removing a Selection
If a respondent wants to remove one of their Image Heatmap selections, this can be done by clicking on that selection and choosing the Remove this point option. Clicking Cancel will take the respondent back to the image.

Reporting
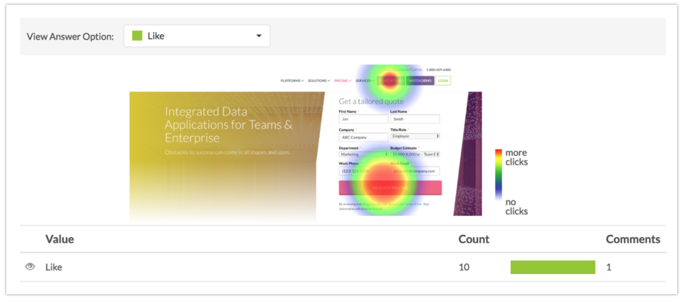
The Image Heatmap question reports as a heatmap element showing aggregated data of your respondents' clicks plotted across your image. The areas of your image with a high density of respondent clicks will be indicated by color intensity (the more red the color, the more respondents have clicked on that area relative to other areas of the image).
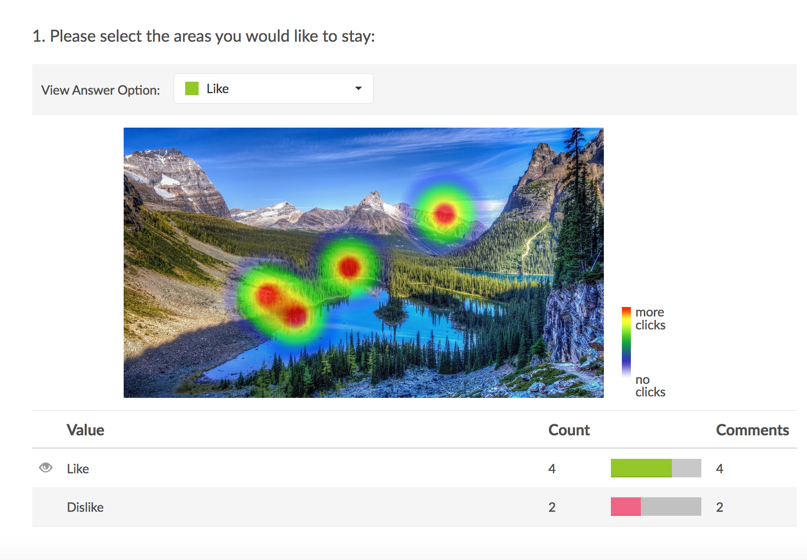
The reporting element allows you to toggle between your Heatmap Options to view the click distribution per option (e.g. Like or Dislike).
You also have the ability to view clicks and comments per response ID (the details can be toggled via the Show/Hide Responses options and display 20 per page). These are hidden by default.

A Note About Heatmap Reporting
In order to ensure that your Image Heatmap data is not skewed by one respondent's repeated clicks on the same area of an image, SurveyGizmo places lower weight on clusters of clicks by one respondent. Lets take a closer look at what this means in the below scenario.
One of your survey respondents clicks several times on one area of your image and clicks once on another area. They select the same heatmap option for all clicks - "Like" (represented by green click markers in the image below):

The resulting report output is as follows:
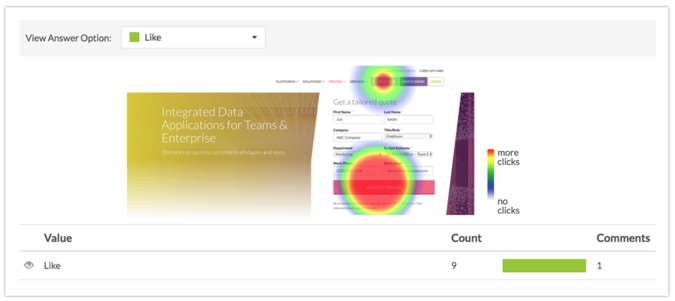
Note that the color intensity is equal for the two click zones (meaning they are equally weighted). Now, the next respondent comes along and clicks on the following part of the image and selects the Like option (they click on the exact spot as the previous respondent):

Now, we see the following change within our report:
The area of the image that the second respondent clicked is now showing a more intense color. This is due to this area having been selected by multiple respondents, whereas the area with less intensity has been selected by one respondent.
See additional compatible chart types
Within the Standard Report there are various chart types available for visualizing your data. The below grid shows which of the chart types Image Heatmap questions are compatible with.


See what other report types are compatible
The below grid shows which of the report types Image Heatmap questions are compatible with. If you plan to do some specific analysis within SurveyGizmo this report compatibility chart should help you choose the right question types!
| Report Type | Compatible |
|---|---|
| Standard | |
| Legacy Summary | |
| TURF | |
| Profile | |
| Crosstab | |
| Comparison |
Exporting
The Image Heatmap exports as coordinates, the Option ID of the selected Heatmap Option (Like or Dislike for example), and the comment associated with that click.
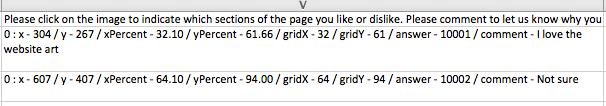
Let's take a closer look the above raw data output for clarification:
0 1 : x - 304 / y - 267 2 / xPercent - 32.10 / yPercent - 61.66 3 / gridX - 32 / gridY - 61 4 / answer - 10001 5 / comment - I love the website art 6
1. The "0" indicates the first click on the image by a single respondent. Should the respondent click on the image a second time, this would be indicated by a 1 and so on.
2. The x and y values are dependent on the size of your image in pixels.
- The x value increases from left to right.
- The y value increases from top to bottom.
- In the example above we count 304 pixels from left to right for the x value and 267 pixels from the top to the bottom for the y value.
Note: When accessed via a mobile device (tablet, smart phone), the image will be resized to fit the smaller screen size. The pixels will reflect the re-sized image size. In this scenario, the xPercent and yPercent values will be a better representation of the clicked area.
3. The xPercent and yPercent values are calculated from the top left of the image. In our example the click occurred 32.10% across the image moving left to right and 61.66% moving down the image (top to bottom).
4. The gridX (left to right) and gridY (top to bottom) values are based on a 100 x 100 grid (counted from the top left of the image).
5. The "answer - 10001" data refers to the Option ID of the Heatmap Option that was selected after the click.
6. Last, we see the comment associated with the image click.
Limitations
- The Heatmap image should be a minimum size of 320 x 320 pixels. A smaller image will be forced to the 320 x 320 size and will likely be distorted as a result.
- The Image Heatmap question is not compatible with Offline Mode.
- The Image Heatmap is not compatible with Word and Excel exports of Standard Reports.
A Note About Image Heatmap Data
Editing your heatmap image after collecting survey responses is highly discouraged as it may result in invalidating your data. You will see the following alert when editing the heatmap question after data collection:
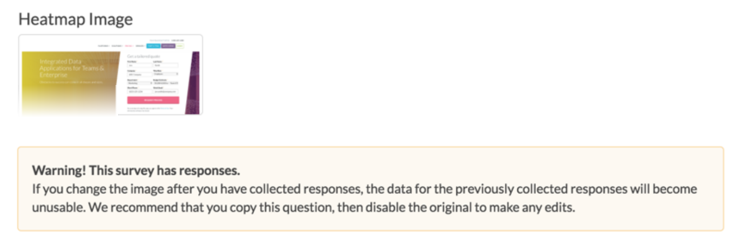
If needing to edit the heatmap image, it is recommended that this question is copied and edits are made in the copy. The original can then be disabled.
Please refer to our best practices on editing a live survey.

Admin
— Dave Domagalski on 09/06/2019
@Fabrizioromano: Thank you for your question!
I'm afraid that there is not a built-in feature to capture the specific time when the first click on the image is made. Additionally, there is not a built-in feature to submit the page based on the first click on the image.
Each of these options would require a custom solution, likely via JavaScript:
https://help.surveygizmo.com/help/adding-javascript-to-your-survey
If you don't have development resources internally and want to explore this with our Professional Services team, please don't hesitate to reach out:
https://www.surveygizmo.com/programming-services/
I'm sorry for these limitations and hope this helps to clarify.
David
Technical Writer
SurveyGizmo Learning & Development
— Fabrizio on 09/06/2019
Hi, Is there anyway to store the time when the first click is made? We need to have an exercise where people should find a product and click, so need to know how long it takes... Another solution would be to submit the page triggered by the first click... Do you have any suggestion on this?
Admin
— Dave Domagalski on 01/23/2019
@Roy: Thank you for your question!
Yes, you can absolutely just collect clicks via the Image Heatmap question.
- When editing the Heatmap question, you will need to provide text for a single answer option as this will be used in reporting (will not be visible to your respondents).
- On the Heatmap’s Validation tab, make sure to set the 'Max Highlights/Points Per Response' field to 1.
- On the Heatmap’s Layout tab, in the Heatmap Comments section, un-check the box to 'Allow comments on heatmap selections'.
This should do the trick!
David
Technical Writer
SurveyGizmo Customer Experience
— Scott on 01/23/2019
We want to use a heatmap-style question to ask where on a web page would people click to find certain information (it's a 'first click' test). Can we just collect clicks, and not have any categories or comments? Can it accept just a single click and then move on to the next question (we don't want multiple clicks per participant)?
Admin
— Dave Domagalski on 08/10/2018
@Peter: Thank you for your question!
The x/y coordinates that are exported will be based on the adjusted width that the image is scaled down to. I'm afraid that there is not a way to know what scale the image was sized to.
The xPercent/yPercent values (within the export) will be reliable in this scenario.
I hope this helps clarify!
David
Documentation Specialist
SurveyGizmo Customer Experience
— Peter on 08/09/2018
Hi there,
If I upload an 1600W image (say 800H) and let Surveygizmo resize based on device, what will the x,y co-ordinates be based off? A scale where x = 1 to 1600? Or will it report based on the adjusted width it scales down to e.g x=1 to 1000 if it scaled down to 1000 wide on screen? If the latter, is there a way to knowwhat scale it sized down to? I'm assuming the x,y will always be based off the original dimensions of the image... Many thanks in advance!
Cheers,
Peter
Admin
— Dave Domagalski on 07/24/2018
@Anna: Thank you for following up!
I'm sorry for the trouble resulting from the limitations of the Image Heatmap reporting.
I'm afraid that at this time the Heatmap reporting does not offer an option to select the sensitivity of the map/image. I'm afraid that there also is not currently a means to see in the report, how many individuals selected a specific area.
I will be forwarding this feedback to our Product team as a potential future enhancement to the Heatmap reporting. I have also reported the current inability to view individual clicks (when not using comments).
I'm sorry for the trouble!
David
Documentation Specialist
SurveyGizmo Customer Experience
Admin
— Dave Domagalski on 07/24/2018
@Peter: Thank you for exploring SurveyGizmo documentation content!
There is a way to achieve what you are looking to do.
When you first create an Image Heatmap question, you will see two answer options by default with Like and Dislike text as placeholders.
You can remove one of these answer options via the red x at the far right of the option. This will leave you with one answer option.
The next step is to make sure that respondents are not presented with Comment fields (these are enabled by default).
1. In order to disable comments, click on the Layout tab of the question.
2. You should see a 'Heatmap Comments' section where you can uncheck the 'Allow comments on heatmap selections' option.
This will leave you with one answer option and respondents can continuously click on the image without leaving comments.
I hope this helps!
David
Documentation Specialist
SurveyGizmo Customer Experience
— Stefano on 07/24/2018
Hi Bri! No, unfortunately, since the comments were disabled for this question, we are not presented with the list of responses so we can't really click on individual responses. Moreover, they are over 1000, so it would be pretty time-consuming and not very insightful to go response by response. It would be cool if we could select the sensitivity of the map. Also, I'm missing a little bit the overall result - if you have 2 distinct areas, how can we know how many ppl selected each area? I mean, it's clear that it's the majority but would be great to be more specific.
— Peter on 07/23/2018
Hi there, Is there a way to have just a single option and allow the user to just continuously click on the image? At the moment, if we wanted to know what people like about an image, it would be a bit onerous for a respondent to click a spot, click like, then save. And then repeat. It would be good if we could just say, click all the parts you like. Click on a spot again to remove it. This of course would be without the comments option.
Admin
— Bri Hillmer on 07/05/2018
@Anna: If you click on each each response in the response table below the heatmap it will show you where each response was clicked! This is shown in the third image in the reporting section of the tutorial.
I hope this helps!
Bri Hillmer
Documentation Coordinator
SurveyGizmo Customer Experience Team
— Stefano on 07/05/2018
Hi!
The heatmap shows an enlarged area of clicks. Is it possible to make it more granular? Not it looks like 1 big red circle. And for us, it's important to know where exactly they clicked.
Admin
— Bri Hillmer on 06/21/2018
@Mandylee: We do not have the functionality you describe however you could use a photo editing tool like Photoshop to draw on the image to divide it up like you describe!
I hope this helps!
Bri Hillmer
Documentation Coordinator
SurveyGizmo Customer Experience Team
— Mandylee on 06/21/2018
Hello, may I know if I want to divide the image in few part then let respondent choose which part of the image they dislike. Can I do that? I have the image sample
Admin
— Dave Domagalski on 05/01/2018
@Jasmijn: Thank you for your question!
I'm afraid that the image cannot be made scrollable by design, as this could potentially bias data (if certain respondents did not realize that the image needed to be scrolled). The image will be responsive to the screen size.
I hope this helps clarify!
David
Documentation Specialist
SurveyGizmo Customer Experience
— Quido.wijnen@tele2.com on 05/01/2018
Can the image be made scrolable?
Admin
— Dave Domagalski on 04/16/2018
@Rose: Thank you for your question!
We recommend a minimum size of 320 x 320 pixels as smaller files will be forced to that size.
With larger images, I would recommend something in the range of 600 - 800 pixels wide to avoid too much scaling down.
I hope this helps!
David
Documentation Specialist
SurveyGizmo Customer Experience
— Rose on 04/16/2018
Is there an ideal image size? We've noticed that larger images are looking fuzzy from being scaled down.
Admin
— Dave Domagalski on 03/20/2018
@Steve: Thank you for your question!
I'm afraid the there is not an option to set the image size within the Image Heatmap question.
We require that the image is at least 320 x 320 pixels. If you are looking for a specific size that is larger than those parameters, the best option for this is to customize the image size prior to uploading the image to SurveyGizmo.
There are a number of free image resizing tools available online, such as http://www.picresize.com/.
I hope this helps clarify!
David
Documentation Specialist
SurveyGizmo Customer Experience
— Steve on 03/20/2018
Can you set the size of the image?